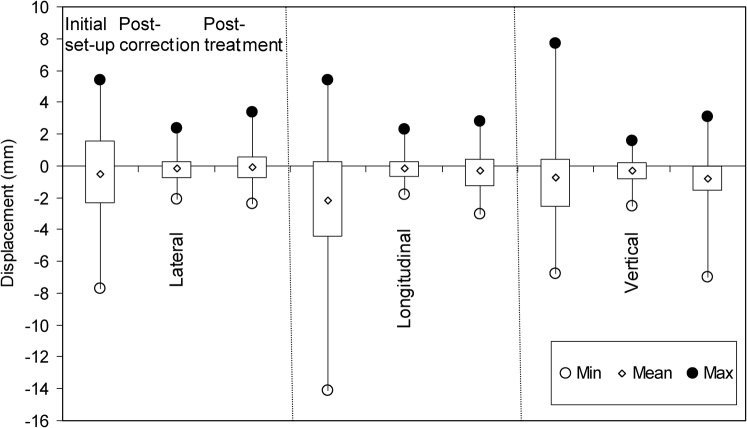
Figure 1.
Comparison of patient set-up errors in the three orthogonal directions from initial set-up, post-correction and post-treatment imaging. The box plots represent the interquartile range of each data set. The minimum value is shown as a hollow circle (○), maximum by a solid circle (•) and mean by a diamond (◊).

