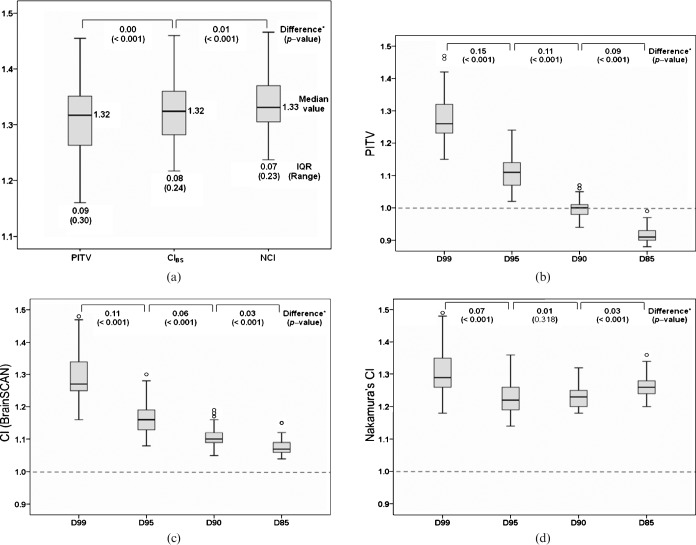
Figure 3.
Influence of the target coverage difference in reference isodose surface (IDS) on the three representative conformity index (CI) values. Box-and-whisker plots show the three CI values calculated at 80% IDS (a) and each CI value defined at D99, D95, D90, and D85 (b: PITV; c: CIBS; d: Nakamura’s CI, NCI). IQR, interquartile range. *The two-tailed p-values were the results of the Wilcoxon signed-rank test.

