
Figure 7.
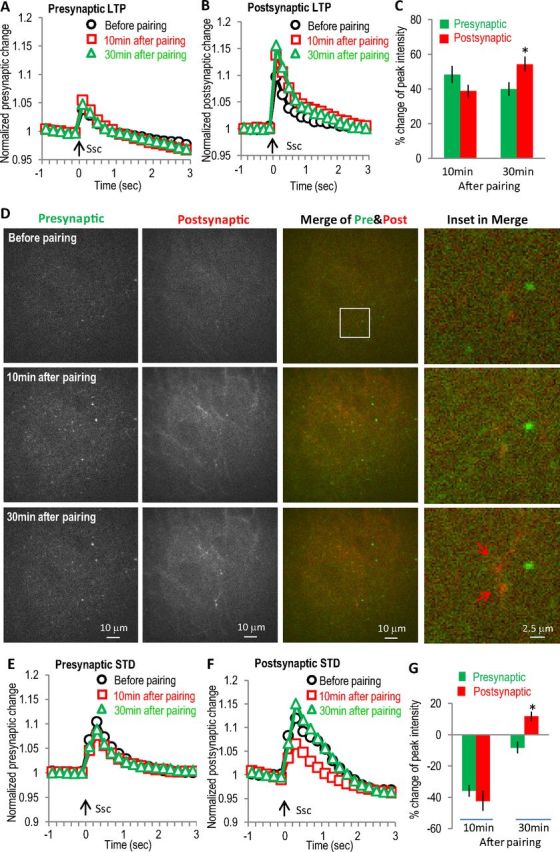
Differential presynaptic and postsynaptic changes in α7 nAChR-dependent LTP and STD revealed with dual-color GECI imaging. GECIs (green GCaMP3 and red R-GECO1) were expressed separately in hippocampal CA3 and CA1 to monitor presynaptic and postsynaptic activities simultaneously for LTP (A–D) and STD (E–G). A, Normalized presynaptic GCaMP3 responses showing smaller enhancement at 30 min than that at 10 min. B, Normalized postsynaptic R-GECO1 responses showing stronger enhancement at 30 min than that at 10 min. C, Bar graph showing the differential changes of the later stage (at 30 min) between presynaptic and postsynaptic activities during the LTP. D, Images of presynaptic and postsynaptic SC stimulation-induced calcium increases at different time points during the LTP. Left two panels show the active presynaptic and postsynaptic calcium responses to SC stimulation, respectively. The third panels are merged images of presynaptic and postsynaptic responses, with the right panels showing some potential spines. E, Normalized presynaptic GCaMP3 responses showing the transient depression after the SO pathway pairing protocol. Arrow indicates stimulation of the SC pathway. F, Normalized postsynaptic R-GECO1 responses showing the transient depression after pairing the SO pathway. G, Bar graph showing the differential recovery between presynaptic and postsynaptic activities during the STD. Ssc, Stimulation of the SC.