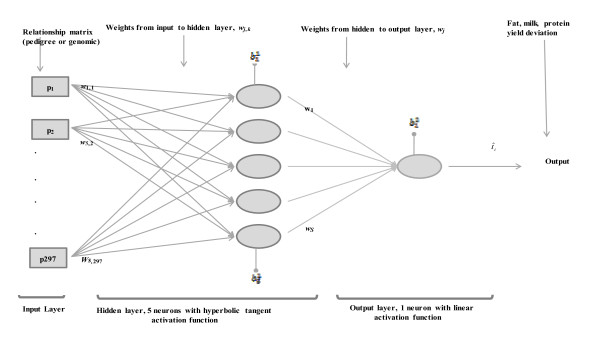
Figure 1.
Illustration of the neural networks used. In the Jersey data there were 297 elements of pedigree or genomic relationship matrices used as inputs (the p's) for each target trait. In the Figure, each pk (k = 1,2,...,297) is connected to 5 hidden neurons via coefficients wj,k (j denotes neuron, k denotes input). Each hidden and output neuron has a bias parameter , j denotes neuron, l denotes layer). The variable represents the trait predicted value for datum i.

