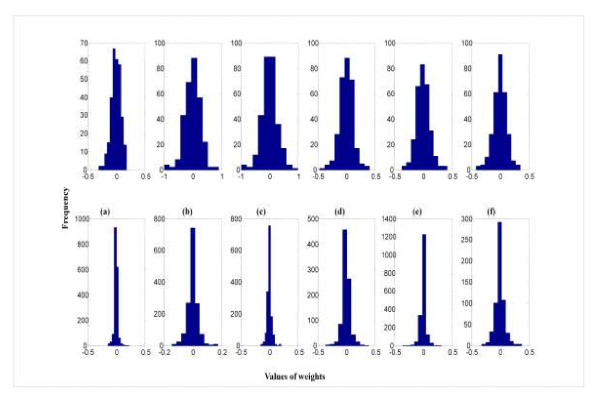
Figure 5.
Distribution of connection strengths(wkj) in the linear and selected networks fitted to the Jersey data. The linear model has single neuron architecture with linear activation functions. a) Fat yield using pedigree relationships: linear model (above) and 6 neurons (below). b) Milk yield using pedigree relationships: linear model (above) and 6 neurons (below). c) Protein yield using pedigree relationships: linear model (above) and 5 neurons (below). d) Fat yield using genomic relationships: linear model (above) and 3 neurons (below), e) Milk yield using genomic relationships: linear model (above) and (below) and 6 neurons (below). f) Protein yield using genomic relationships: linear model (above) and 2 neurons (below).

