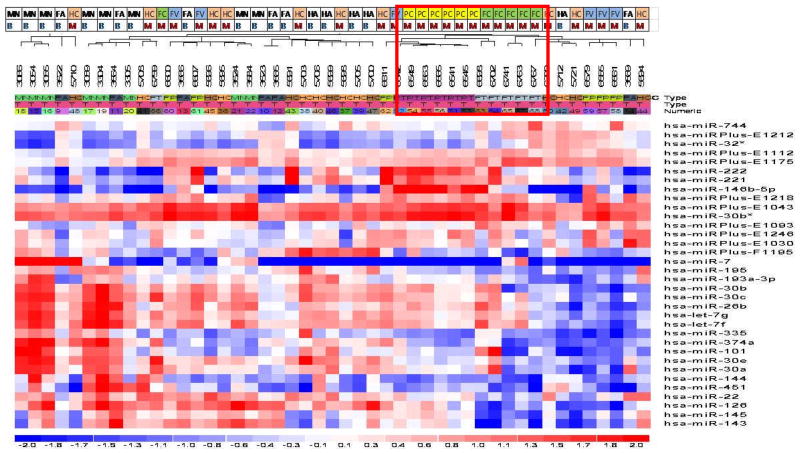
Figure 2.
Supervised cluster analysis of the top 34 differentially expressed miRNAs. Each row represents a miRNA and each column represents a sample. The top row indicates the specific tumor types [follicular adenoma (FA), multinodular goiter (MN), Hürthle cell adenoma (HA), Hürthle cell carcinoma (HC), papillary thyroid carcinoma (PC), follicular variant of papillary thyroid carcinoma (FV), follicular thyroid carcinoma (FC)]. There is clustering of PC and FC.

