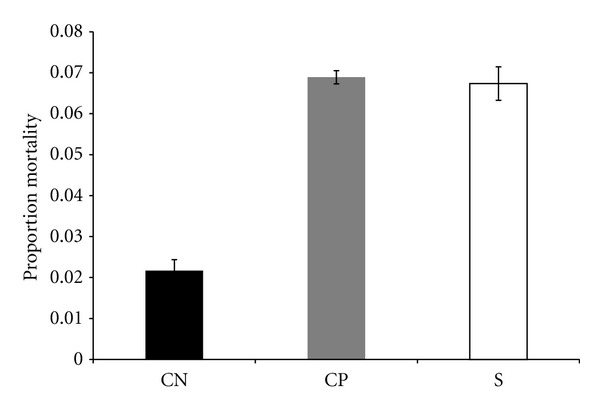
Figure 7.

Average proportion mortality after treatment with autoclaved spores. The average was obtained by pooling all of the variates for all lines of the same type. S—selected lines, CP—lines punctured with H2O (wound control), CN—no perturbation lines.
