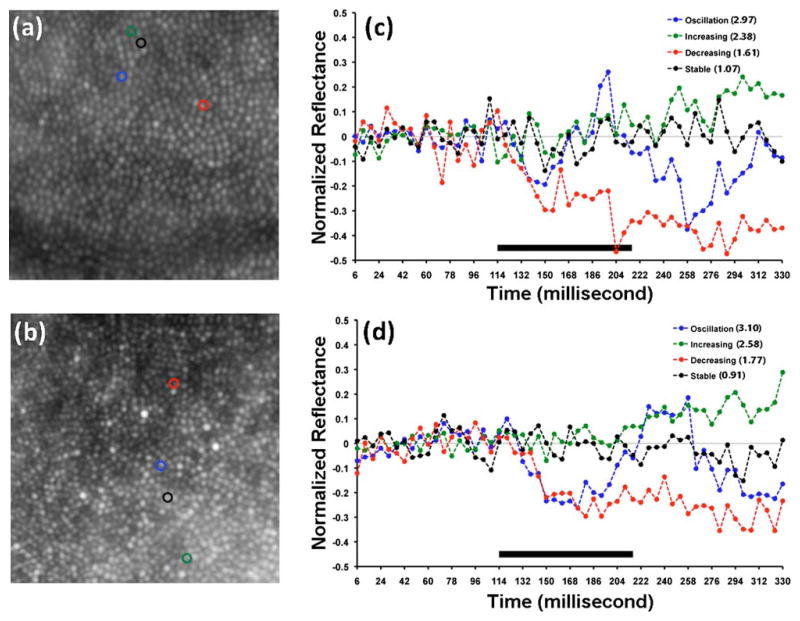
Fig. 3.
(Color online) Visible-light induced changes in cone reflectance. (a),(b) Averaged images of the cone mosaic derived from a registered stack of 55 individual frames. The size of each image is 0.5° × 0.5°. (c),(d) Optical reflectance profiles of cones marked in (a) and (b). RMS ratios for each cone are listed on the plot in the legend. Solid bar indicates duration of visible light stimulus.

