
Figure 5.
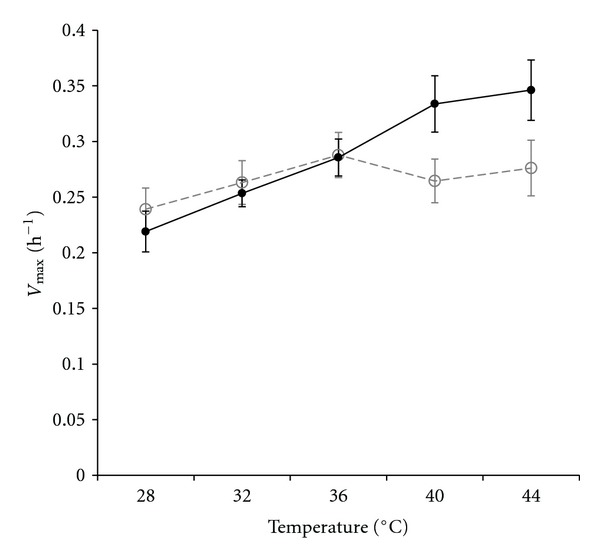
Maximum growth rate, V max, of a subset of summer (solid line) and winter (dashed line) populations as a function of temperature. Error bars represent 95% confidence intervals, based on 3-fold replication and number of genotypes (9 summer, 6 winter).