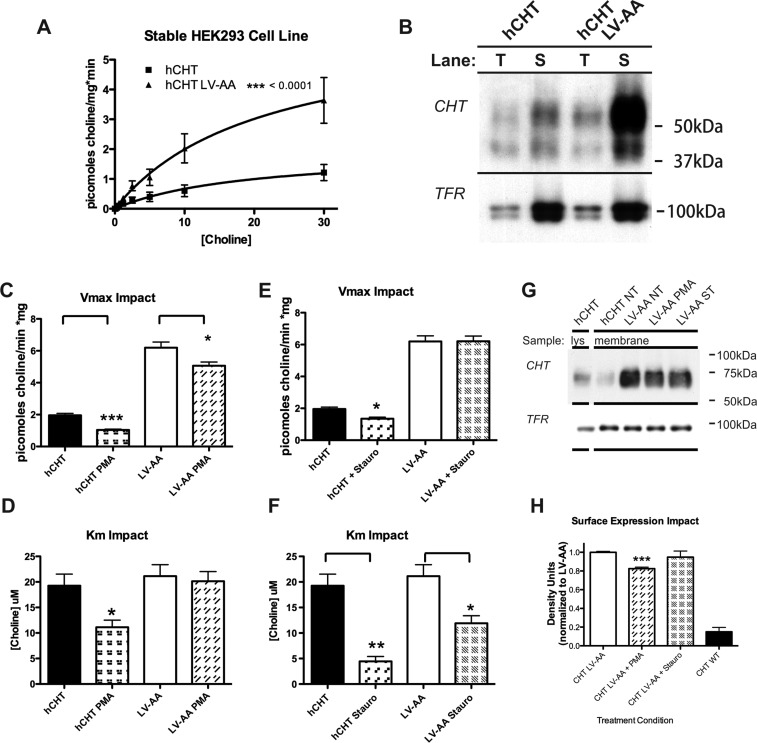
Figure 4.
Generation of CHT expressing stable cell lines to facilitate HTS development. HEK293 cell lines were generated expressing CHT and the LV-AA mutant. (B) The expression of WT CHT and CHT LV-AA was characterized by saturation kinetic analysis. LV-AA CHT demonstrates a 3-fold increase in Vmax (see Tables 1–2). (A) These cell lines were analyzed for cell surface expression by membrane impermeant biotinylation; again as shown for the transient expression, LV-AA CHT has a much greater cell surface expression. (C–D) Saturation kinetic analysis of the cell lines was performed under the condition of no treatment and PMA treatment to activate PKC. The PMA treatment reduced measured Vmax. (E–F) Saturation kinetic analysis was performed under the condition of staurosporine treatment to inhibit kinase activity. The predominant effect was a reduction in measured KM. (G–H) The surface trafficking impact of PMA and staurosporine treatment was examined using membrane impermeant cell surface biotinylation in the CHT LV-AA cell line. Treatment of the cell line with PMA, but not staurosporine, leads to a significant reduction in cell surface expression (p = 0.0005, n = 3, Student t-test).

