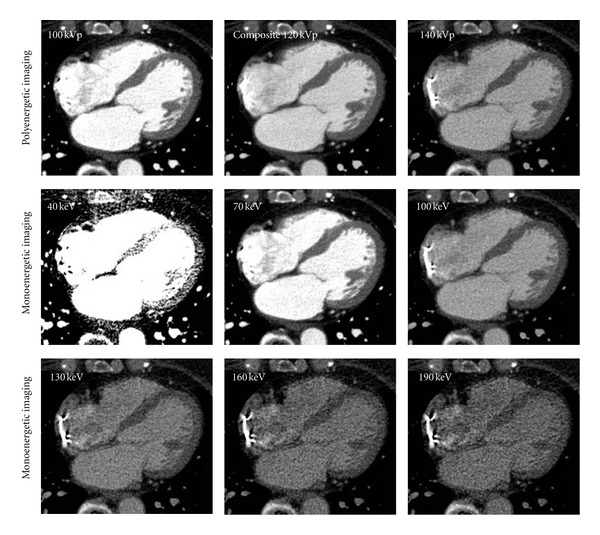
Figure 4.

Clinical images; typical polyenergetic (top row) and monoenergetic (bottom rows) axial cardiac images. All images are displayed with a window width of 600 HU and window level of 200 HU. In the polyenergetic images, the cardiac cavity was most clearly visualized in the 100-kV image and darkened with the progressive increase in tube energy. In the monoenergetic images, the cardiac cavity and vertebrae appeared the brightest in the 40 keV image and darkened with the progressive increase in effective energy.
