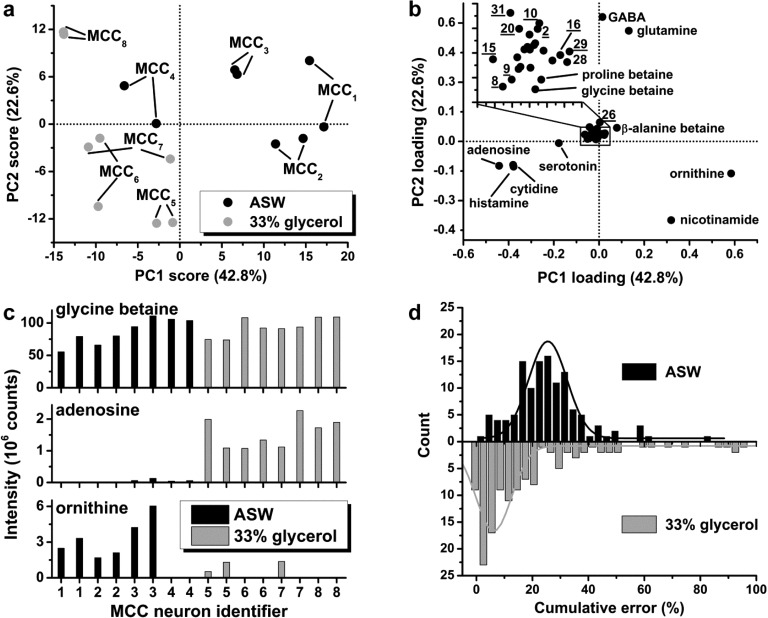
Figure 1.
Analyte extraction strategies for single isolated MCC neurons of the A. californica CNS. (a) PCA score plot of the CE-ESI-MS data revealed differences between sample extracts: cells isolated in ASW and 33% glycerol-ASW solutions form separate data clusters. Duplicate analytical measurements are included. (b) The PCA loading plot helped to identify specific metabolic differences between the cell extracts. Underlined numbers correspond to compounds identified in Table 1. (c) The composition of the cell-isolation solution had a pronounced effect on extraction efficiency for many, but not all, metabolites. For example, when isolating neurons in glycerol-ASW, the ion signal intensities did not appreciably vary for glycine betaine, significantly increased for adenosine, and decreased for ornithine. Bars correspond to individual cells measured in technical duplicates. (d) Histograms show the cumulative measurement error as RSD for 35 metabolites measured in duplicate. Gaussian curves (solid lines) fitted on these data had a median and width of ∼24% (RSD) and ∼16% for cells isolated in ASW, and ∼6% (RSD) and ∼13% for those treated with 33% glycerol-ASW. The higher analytical reproducibility offered by glycerol stabilization was beneficial for assessing chemical changes upon neuron culturing. Key: MCC1–4 = freshly isolated and MCC5–8 = glycerol-stabilized MCC cell extracts.

