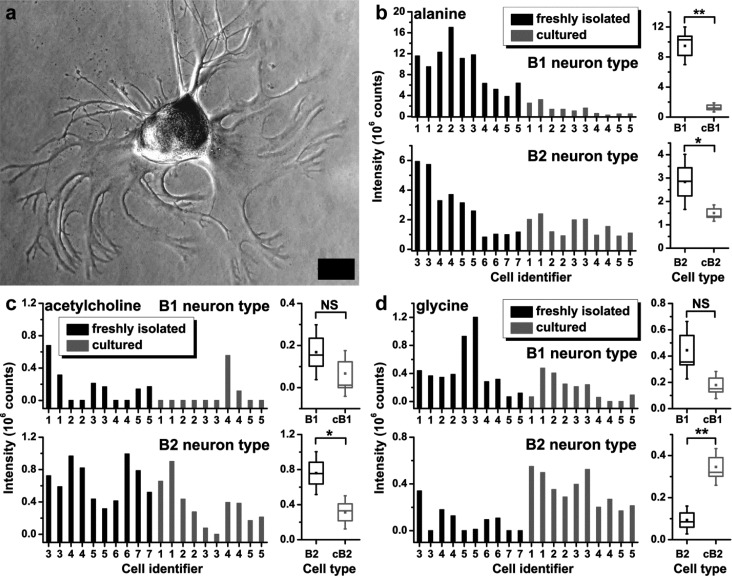
Figure 3.
Morphological and statistically significant metabolic changes upon single-cell culturing. (a) In culture, B1 and B2 neurons typically formed a network of neurites overnight, as demonstrated in the microscope image of a representative cultured B2 cell. (b) Statistical analysis of the data revealed that culturing imposed cell-type dependent variations in neuron chemistries. For example, both neuron types in culture became depleted in alanine. (c) Acetylcholine abundance decreased in the B2 but not the B1 neurons. (d) In stark contrast, other compounds such as glycine accumulated in the B2 neurons only. Bars correspond to individual cells measured in technical duplicates. Key: square, box, and whisker represent statistical median, standard error, and confidence interval, respectively. NS labels statistically insignificant variations, and asterisk (*) and two asterisks (**) mark p-values below 0.05 and 0.005, respectively. Scale = 50 μm.

