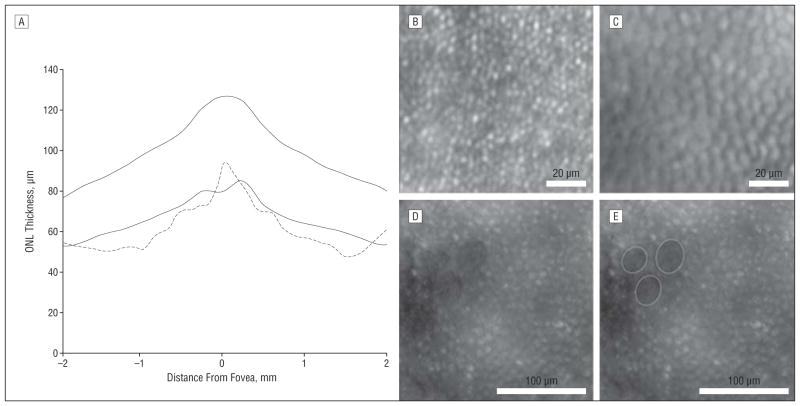
Figure 2.
Evidence for cone photoreceptor degeneration. A, Comparison of the patient’s outer nuclear layer (ONL) thickness (dashed line) with the average ONL thickness in 97 healthy control subjects reveals significant thinning. Solid lines indicate ±2 SDs from the mean. An adaptive optics image of the right eye from a normal retina at a 1° temporal location (B) and a corresponding image from the patient (C) are shown. The density of the “bubble wrap” structures is 14 917 cells/mm2. Normal cone density at this location is about 37 000 cones/mm2, based on histologic findings6 and adaptive optics data4 from other groups. D and E, Images from a 3° nasal location show heterogeneous areas of variably sized reflecting structures interleaved with 3 craterlike lowly reflecting patches (outlined in E).

