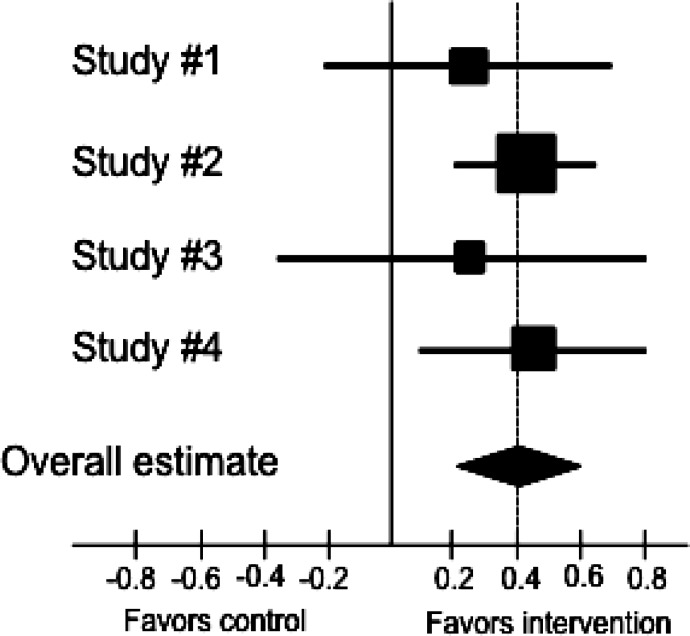
Figure 3.
Example of a forest plot: the squares represent the effect estimate of the individual studies and the horizontal lines indicate the confidence interval; the dimension of the square reflects the weight of each study. The diamond represent the summary point estimate is usually represented with a diamond at the bottom of the graph with the horizontal extremities indicating the confidence interval. In the example as standardized outcome measure the authors used d.

