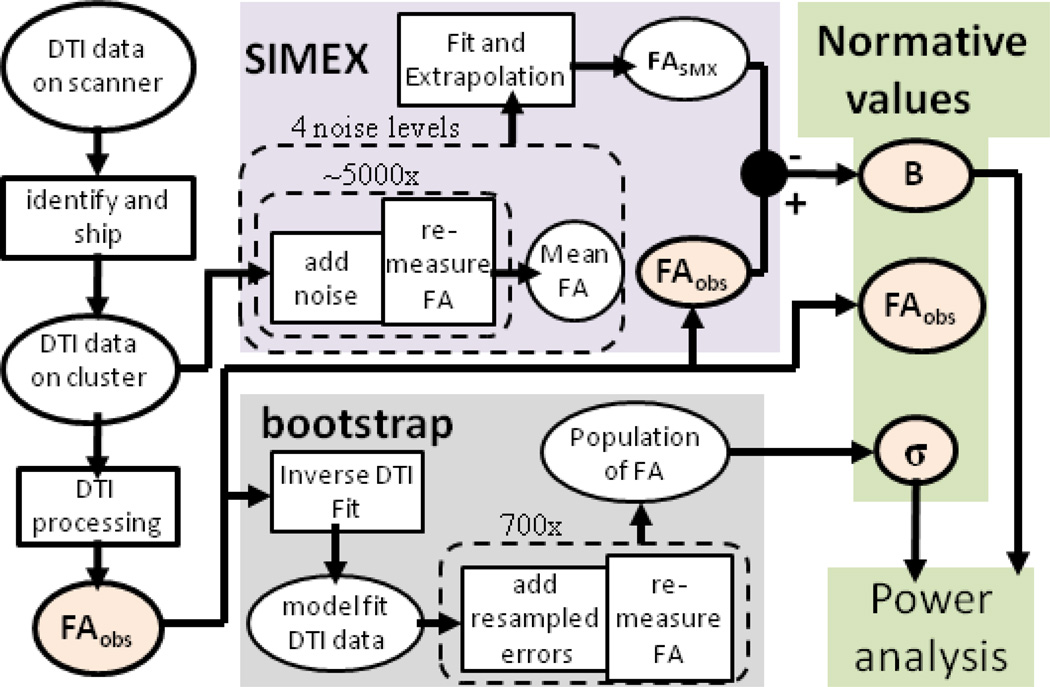
Figure 1.
Flow chart of quality analysis pipeline. The flow chart begins in the upper left corner with data collected on the scanner. The data undergoes DTI processing followed by analysis with SIMEX to measure bias, BFA, and bootstrap to measure the variance of FA, σbs. These parameters are then kept for the development of normative values and for power analyses.

