Figure 4.
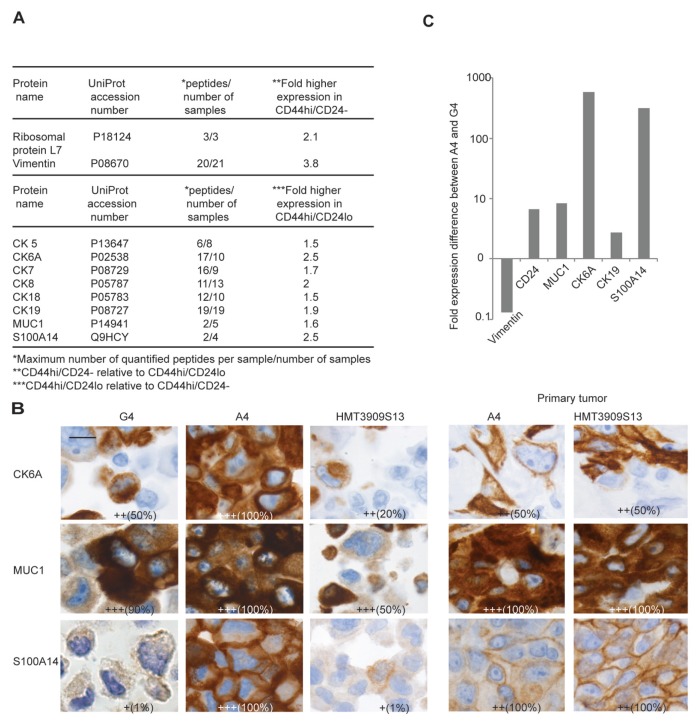
Identification of proteins exhibiting altered expression levels between CD44hi/CD24lo and CD44hi/CD24− cells using comparative quantitative mass spectrometry–based proteomics of SILAC cells and validation of selected proteins. (A) A list of proteins exhibiting altered expression between CD44hi/CD24lo and CD44hi/CD24− cells. (B) ICC with estimated staining intensity and number of cells expressing CK6A, MUC1 and S100A14 in G4, A4 and the parental cell line compared with IHC of primary tumors established with A4 and HMT3909S13 inoculated into NOG mice. Scale bar: 20 μm. (C) Fold-change expression levels of mRNA of selected candidates in A4 and G4 measured by quantitative real-time PCR identifying CD24, MUC1, KRT6A (CK6A), KRT19 (CK19 ) and S100A14 upregulation in A4 at the mRNA level, whereas VIM is downregulated compared with G4. The number 1 (y axis) corresponds to equal mRNA expression in the two cell lines.

