Figure 1.
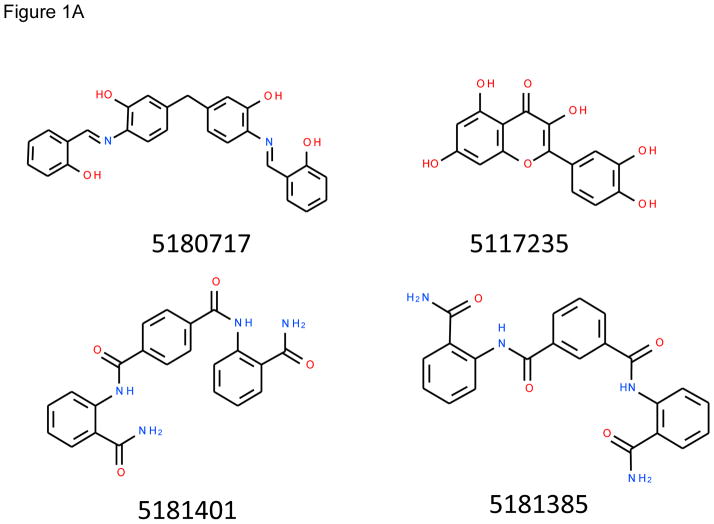
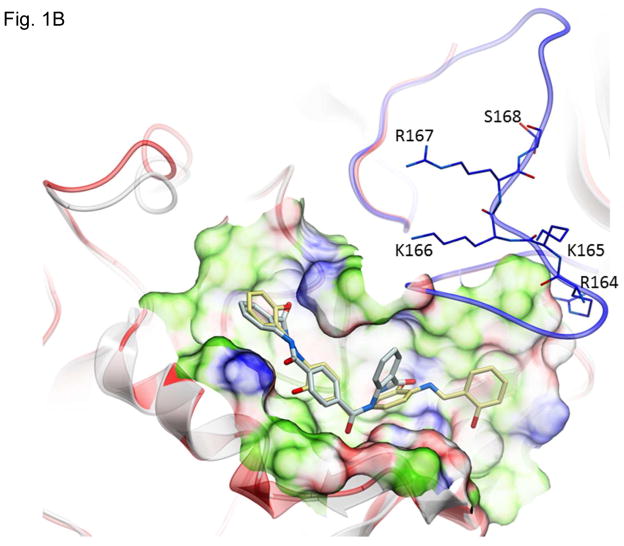
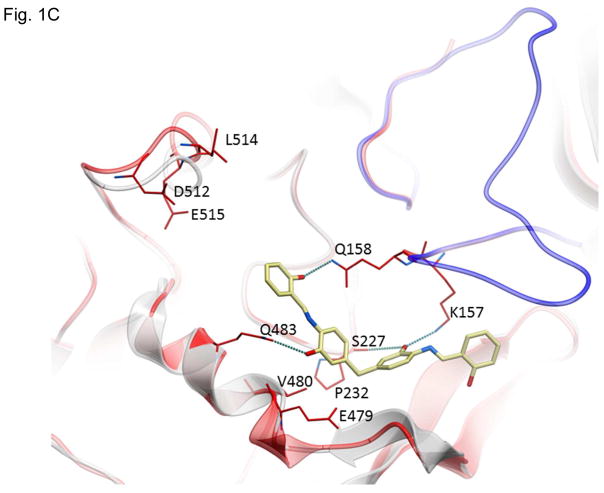
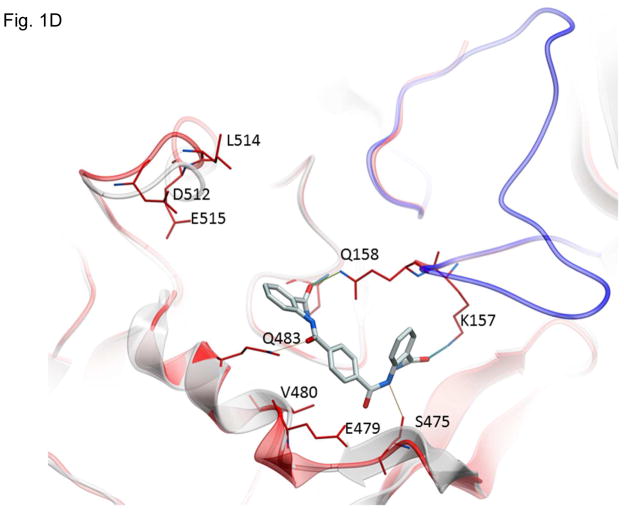
Structures of inhibitors and modes of binding to PA. (A) The compounds characterized in this study. (B) PA crystal structure 1T6B (red ribbon) superimposed on the crystal structure 3TEW (grey ribbon) with the ordered furin loop in 3TEW highlighted in blue. The furin-type protease cleaves after the sequence 164RKKR which is shown in stick representation with carbon atoms colored blue. The predicted binding poses for inhibitors 17 and 01 are displayed in stick representation with carbon atoms colored yellow and grey, respectively. The binding pocket surface for 1T6B used for virtual screening is displayed (White = neutral surface, Green = hydrophobic surface, Red = hydrogen bonding acceptor potential, Blue = hydrogen bond donor potential). (C) and (D) Predicted interactions of 17 (yellow stick) and 01 (grey stick), respectively, with PA. Hydrogen bonds are displayed as small colored spheres and both ligands make common hydrogen bonds with Q158, Q483, and K157.


