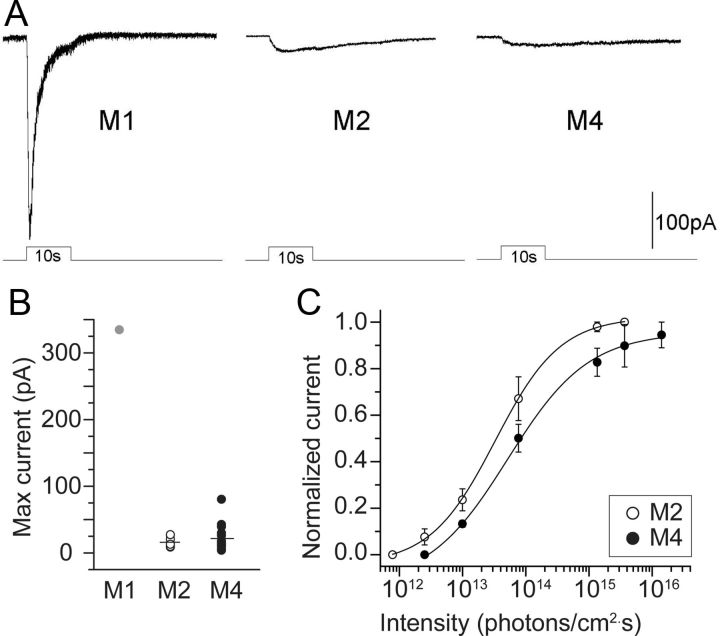
Figure 4.
Comparison of melanopsin-driven intrinsic light responses of M1, M2, and M4 ipRGCs in Opn4Cre/+;Z/EG+/− mice. A, Whole-cell voltage-clamp recordings of light-evoked currents in typical M1, M2, and M4 ipRGCs during pharmacological blockade of retinal synapses (stimulus: 480 nm, 10 s, 1.2 · 1017 photons · cm−2 · s−1). B, Maximum (Max) photocurrents, evoked as in A, in M1 (gray circle), M2 (open circles), and M4 (black circles) cells. C, Intensity–response relations were constructed from photoresponse families to light steps (480 nm, 5 s), normalized to the peak response, averaged, and fitted with a logistic dose–response function. The IR50 (light intensity yielding half-maximal response) is 3.5 · 1013 photons · cm−2 · s−1 for M2 cells (n = 4) and 8.5 · 1013 photons · cm−2 · s−1 for M4 cells (n = 4). Error bars indicate SEM.

