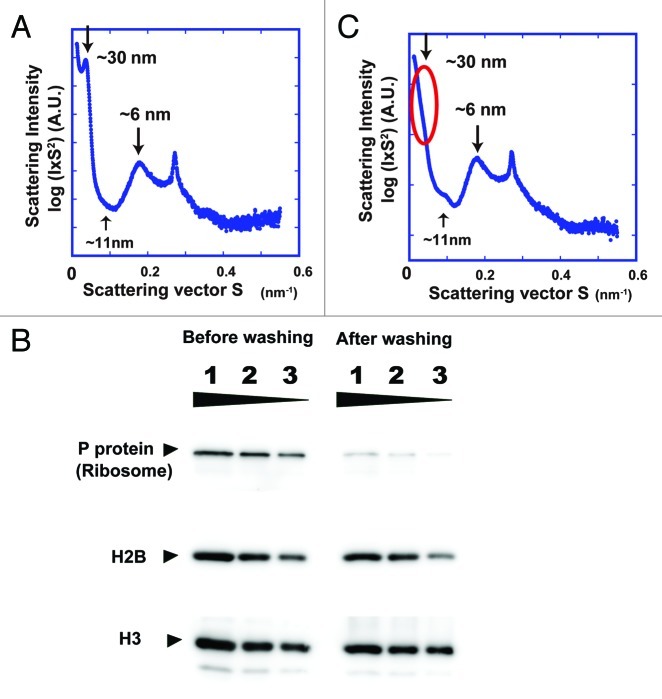
Figure 3. (A) SAXS profile of HeLa interphase nuclei, which were isolated using the Langmore and Paulson procedure.18,19 Three peaks at ~6, ~11 (faint) and ~30 nm were detected (arrows). In the plot of log(I × S2) vs. S, I is the measured average intensity and S is the size of the scattering vector, the inverse of the structure size or spacing (for details, see ref. 15). The 6- and 11-nm peaks are thought to come from edge-to-edge and face-to-face positioning of the nucleosomes, respectively. The 30-nm peak was assumed to represent the side-by-side packing of 30-nm chromatin fibers. (B) The presence and removal of ribosomes in the HeLa interphase nuclei were verified by western blotting. Nuclear lysates of ~2 × 10⁴, 1 × 10⁴, and 5 × 10³ cells were loaded into lanes 1–3, respectively. Proteins were separated by SDS-PAGE and then transferred to membranes. Ribosomal P-protein64 and histone H2B (control) and histone H3 (control) were detected using specific antibodies (H2B, Upstate 07–371; H3 Abcom ab1791). P-protein was detected in the original nuclei, but much less in the nuclei after washing, whereas histones H2B and H3 were similarly observed in both nuclei. (C) Only the 30-nm peak disappeared after removal of ribosome aggregates, whereas the other peaks remained.

An official website of the United States government
Here's how you know
Official websites use .gov
A
.gov website belongs to an official
government organization in the United States.
Secure .gov websites use HTTPS
A lock (
) or https:// means you've safely
connected to the .gov website. Share sensitive
information only on official, secure websites.
