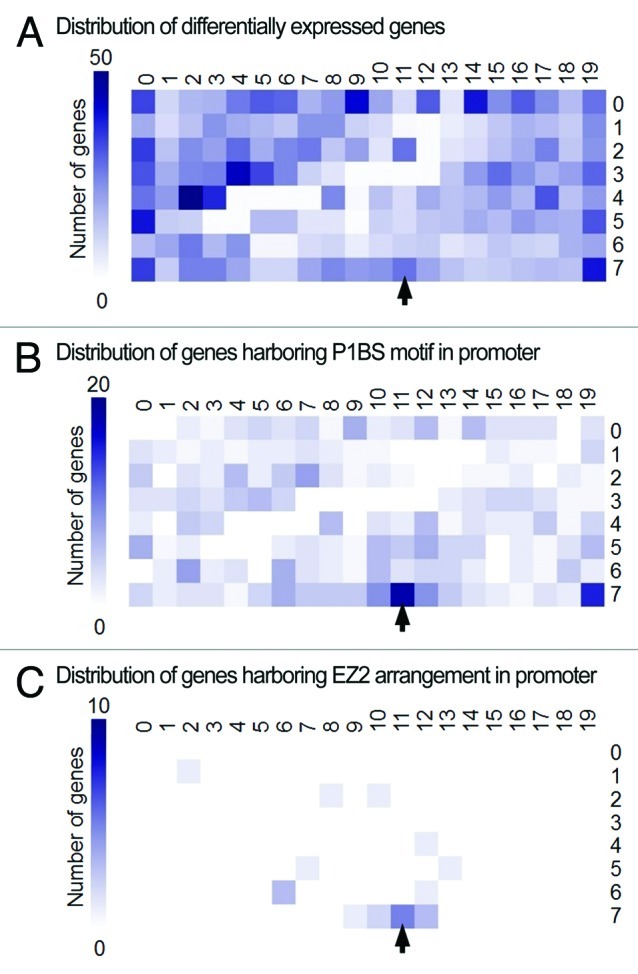
Figure 2. Distribution of the P1BS motif variant and the EZ2-like arrangement in Pi-responsive genes. (A) SOM displaying the distribution of 2739 probes called differentially expressed according to their signal values in shoots and roots of wild-type plants grown under Pi-limiting or Pi-sufficient conditions (data from experiment NCBI GEO accession GSE16722). Probes are organized based on the similarity of their expression profiles, thus probes showing similar patterns are clustered into the same or adjacent cells. (B) SOM displaying the distribution of 440 genes containing the P1BS motif variant (GVATATNCB) in their 1 kb proximal promoter regions. (C) SOM displaying the distribution of 21 genes containing an EZ2-like arrangement of P1BS motifs in their 1 kb proximal promoter regions. The gradient scale on the left of each map designates the number of genes in a given cell. Arrow indicates location of PLDZ2 in the map.
