
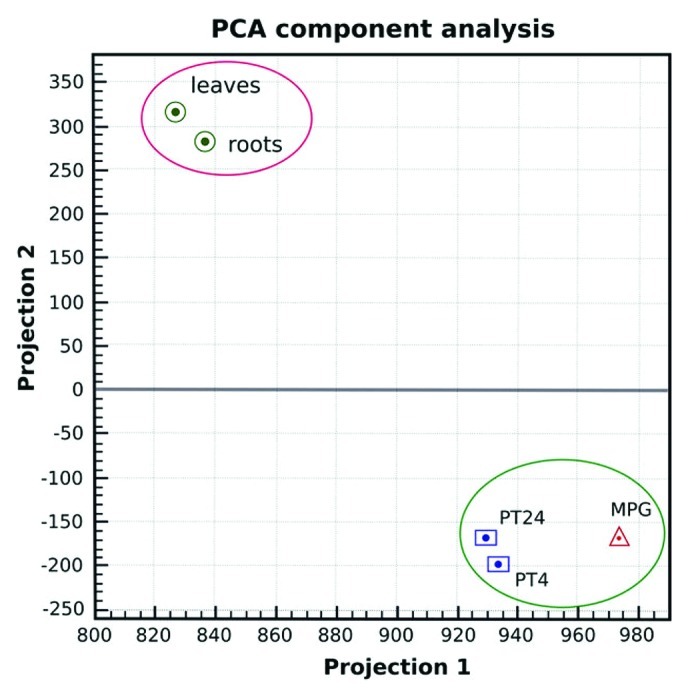
Figure 1. Output of the first and second principal component (PCA) analysis of the log2-transformed data sets. The largest and second-largest principal component (variability projection 1 and 2, respectively) are displayed in orthogonal directions, assessing the overall homogeneity between replicates and variability between samples of different tissue types as reflected in their grouping.