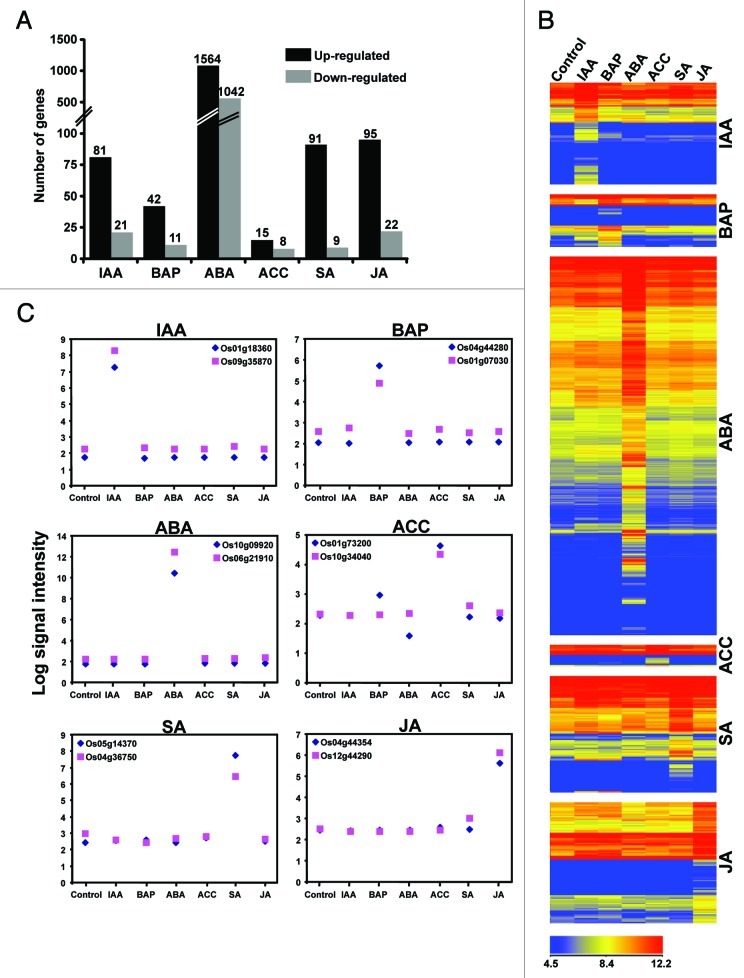
Figure 3. Rice genes specifically regulated by single hormone. (A) Number of genes significantly up- and downregulated only in the presence of specific plant hormone is shown. (B) Heatmap showing the expression profiles of genes specifically regulated by single hormone. The color scale at the bottom represents average log signal intensity values. (C) Expression patterns of representative hormone-specific marker genes. Hormone abbreviations are same as given in Figure 1.

An official website of the United States government
Here's how you know
Official websites use .gov
A
.gov website belongs to an official
government organization in the United States.
Secure .gov websites use HTTPS
A lock (
) or https:// means you've safely
connected to the .gov website. Share sensitive
information only on official, secure websites.
