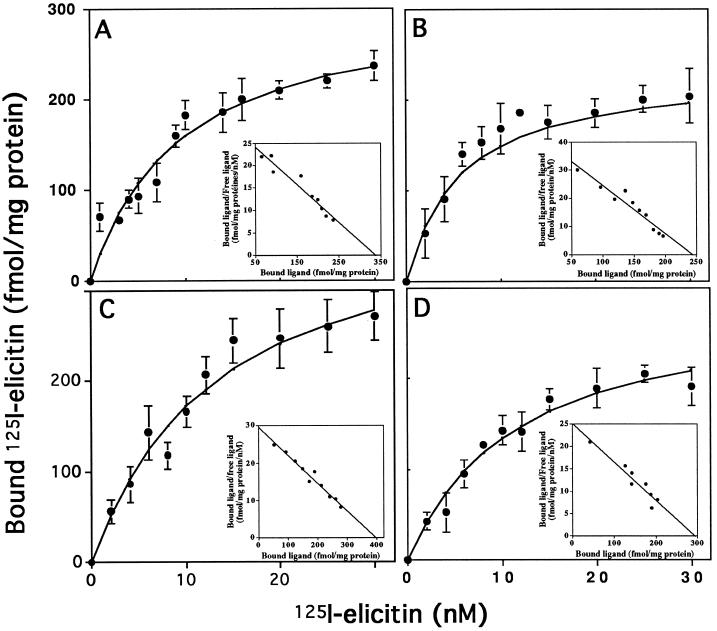
Figure 1.
Saturation curves obtained with labeled elicitins and corresponding Scatchard plots (insets). Plasma membrane preparations were incubated with various concentrations of 125I-cryptogein (A), 125I-cinnamomin (B), 125I-capsicein (C), or 125I-parasiticein (D). Nonspecific binding was measured in the presence of a 10 μm concentration of the corresponding nonlabeled elicitin and was subtracted from total binding to give the saturation curves. Experiments were repeated at least three times. Results are means ± sd.

