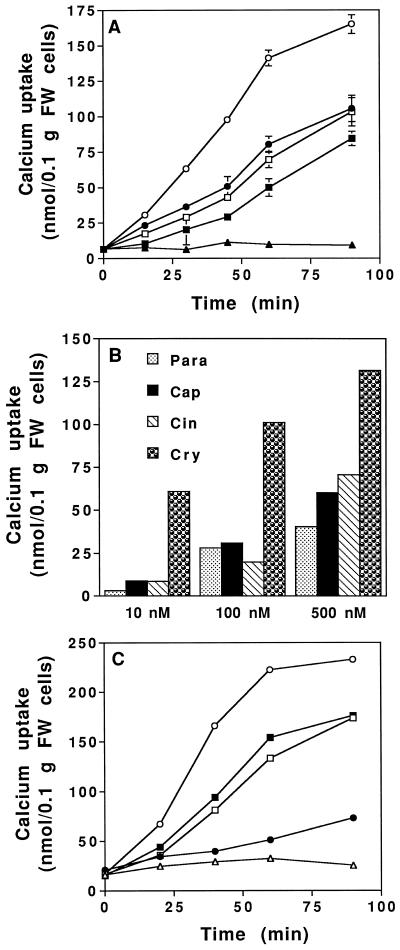
Figure 5.
Effect of various concentrations of elicitins on 45Ca2+ influx into tobacco cells. A, Time course of 45Ca2+ uptake by tobacco cells after treatment with 500 nm elicitins: cryptogein (○), cinnamomin (•), capsicein (□), and parasiticein (▪); control cells (▴) in a 2 mm Hepes low-buffered medium, pH 5.75. B, Effects of increasing concentrations of elicitins on 45Ca2+ uptake into tobacco cells after 1 h of incubation with cryptogein (Cry), cinnamomin (Cin), capsicein (Cap), or parasiticein (Para) in a 2 mm Hepes low-buffered medium, pH 5.75. C, Time course of 45Ca2+ uptake by tobacco cells after treatment with 100 nm elicitins: cryptogein (○), cinnamomin (•), capsicein (□), or parasiticein (▪); control cells (▴) in a 50 mm Hepes medium buffered at pH 7.0. Each point corresponds to a duplicate assay. Results are means ± sd. Specific activity of 45Ca2+ = 6.6 GBq/mol. FW, Fresh weight.

