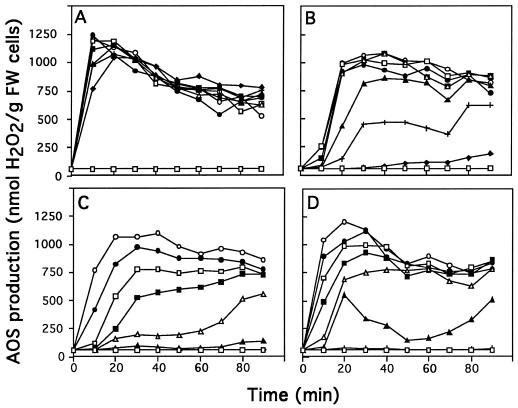
Figure 6.
AOS production in tobacco cell suspensions (nmol H2O2 g−1 fresh weight cells) treated with increasing concentrations of elicitins: 5 nm (♦), 10 nm (+), 25 nm (▴), 50 nm (▵), 75 nm (▪), 100 nm (□), 250 nm (•), and 500 nm (○). Cells were treated with cryptogein (A), cinnamomin (B), capsicein (C), or parasiticein (D). The experiment was repeated three times. The figure corresponds to a representative experiment. FW, Fresh weight.

