
Figure 1.
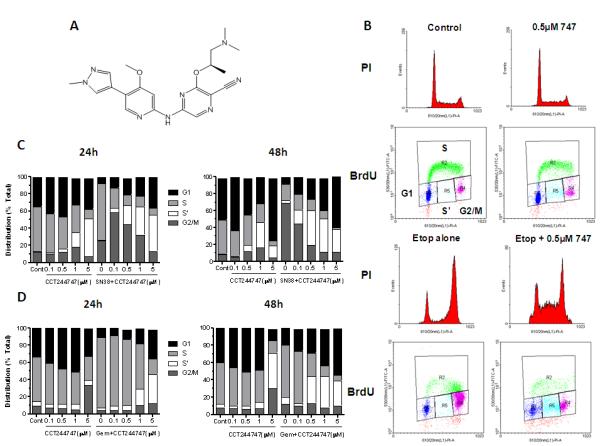
Structure and effects of CCT244747 on drug induced cell cycle arrest in human colon cancer cell lines. A, Structure of CCT244747. B, Effects of CCT244747 exposure (0.5μM × 23h) on etoposide induced (25μM × 1h) cell cycle arrest in HT29 tumor cells measured 23h following cytotoxic treatment. Histograms: cell cycle distribution was assessed by propidium iodide DNA staining; Dot blots: DNA synthesis and distribution were measured by BrdU incorporation and DNA staining with PI. Cell cycle distribution (G1, S, S’ and G2/M) was quantified using BrdU staining as shown and described in Materials and Methods. C, Quantification of the effects of different concentrations of CCT244747 on SN38 (20nM) induced cell cycle arrest in HT29 cells measured following 24h and 48h exposure. D, Comparable data for the effects of different concentrations of CCT244747 on gemcitabine (10nM) induced cell cycle arrest in SW620 cells following 24 and 48h treatments. Similar results were obtained in repeat experiments.