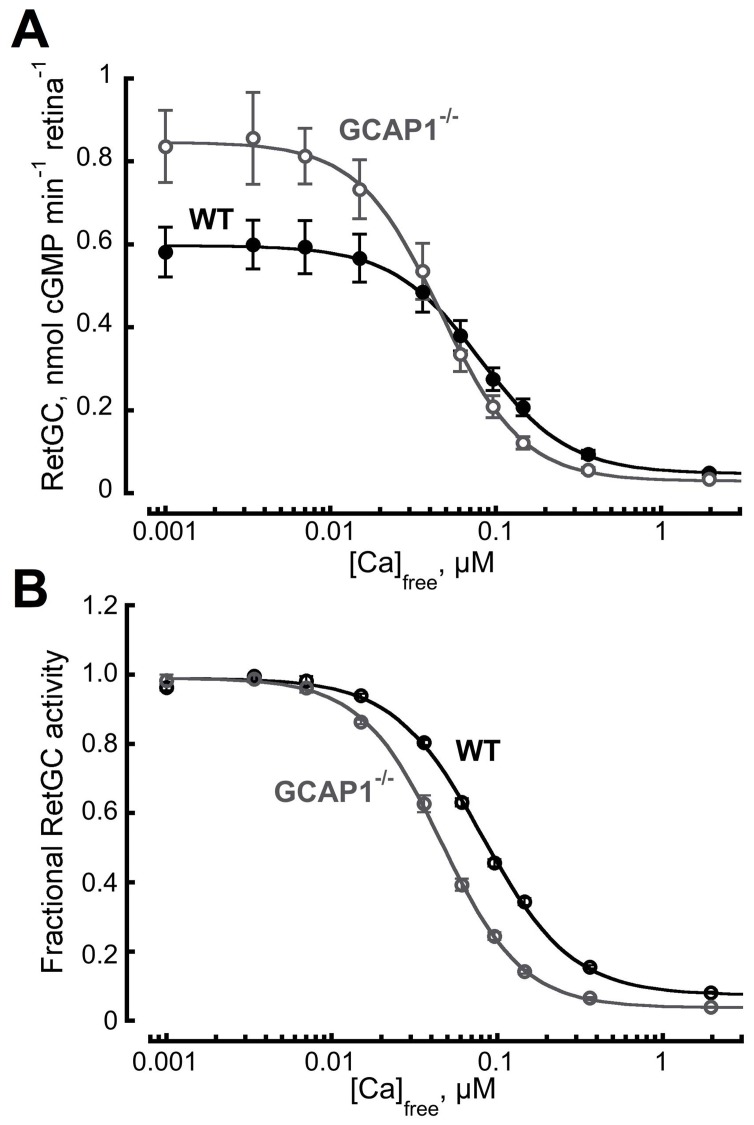
Figure 3. Altered RetGC activity in GCAP1−/− mouse retinas.
Total (A) and normalized (B) cGMP synthetic activity in WT (•, n = 5) and GCAP1−/− (○, n = 4) retinas as a function of free Ca2+ concentration. Notice that sensitivity shifted to lower levels of Ca2+ in GCAP1−/− retinas. In panel B, the activities in each series were normalized by the corresponding maximal RetGC activity measured in each genotype and averaged for each group. The data were fitted by the equation, A = (Amax – Amin)/(1+([Ca]/[Ca]1/2)h) + Amin; where Amax and Amin are the maximal and the minimal activity of guanylyl cyclase, respectively, [Ca]1/2 is the concentration of Ca2+ producing 50% inhibition, and h is a Hill coefficient. RetGC activity was assayed as described in Materials and Methods. Amax values for the WT and GCAP1−/− retinas were 0.6 and 0.8 nmol cGMP min−1 retina−1, [Ca]1/2 values were 81 and 46 nM, and h values were 1.8 and 1.6, respectively.

