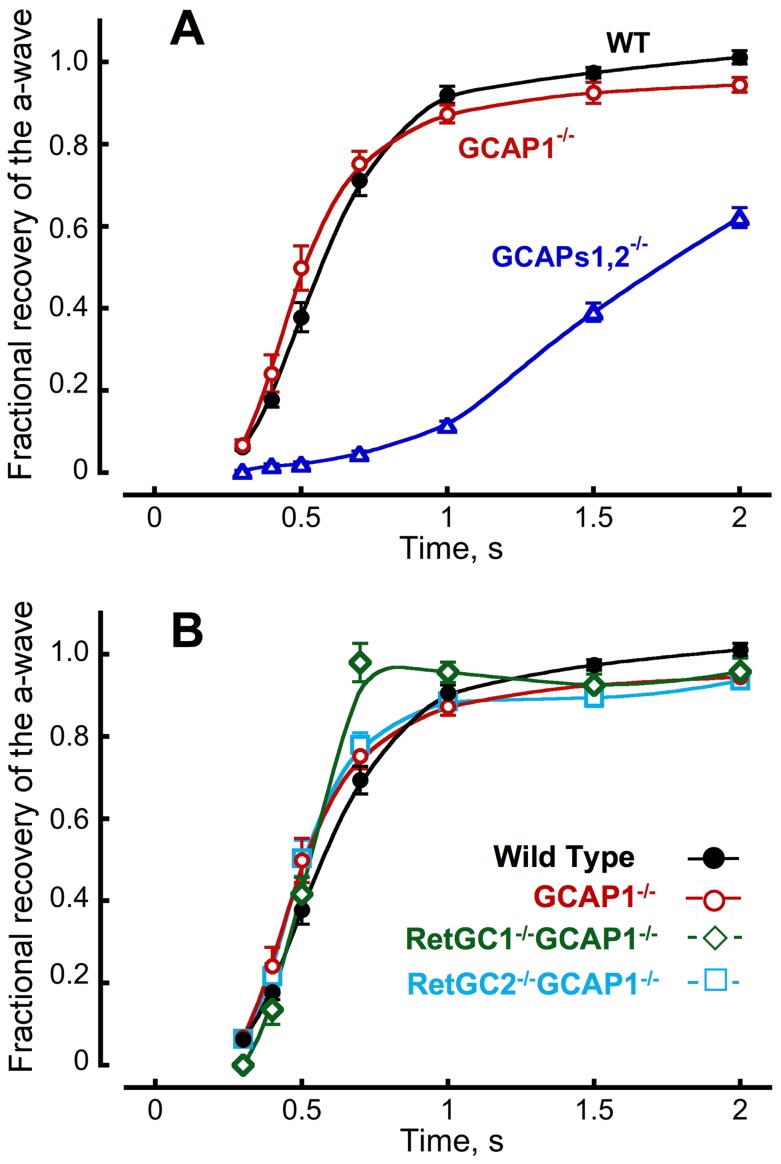
Figure 4. Recovery of bright flash response of rods, reconstructed from recordings of paired-flash ERGs.
A. Fractional a-wave recovery from a strong flash, presented at time zero, in paired-flash ERGs from 16 WT (•) [22], 17 GCAPs1,2−/− (▵), and 17 GCAP1−/− (○) mice aged 1.5–3 months. B. The recovery remained fast in the absence of each RetGC isozyme; 16 WT (•), 17 GCAP1−/− (○), 18 RetGC1−/−GCAP1−/− (⋄), and 17 RetGC2−/−GCAP1−/− (□) mice. The average saturating a-wave amplitudes in WT, GCAP1−/−, GCAPs1,2−/−, RetGC1−/−GCAP1−/−, and RetGC2−/−GCAP1−/− were 532, 347, 365, 98, and 277 µV, respectively. The continuous curves were ‘smooth line’ fit by KaleidaGraph software. In many cases, only the initial phase of the ERG recovery could be fit by a single exponential. The time required for 50% amplitude recovery determined from the exponential portion of the fit in 16 mice for each genotype was (mean ± SEM): 0.55±0.02, 0.51±0.02, 0.50±0.02, 0.51±0.02, and 1.78±0.06 s in WT, GCAP1−/−, RetGC1−/−GCAP1−/−, RetGC2−/−GCAP1−/−, and GCAPs12−/−, respectively. In all-pairs comparison, the only significant difference for the entire group (P<0.0001, one way ANOVA with a Bonferroni post-hoc test, alpha = 0.01) was found between GCAPs1,2−/− and all other genotypes. Contribution of a small fraction [45] of mouse cones to the scotopic a-wave amplitude was considered insignificant for this analysis.

