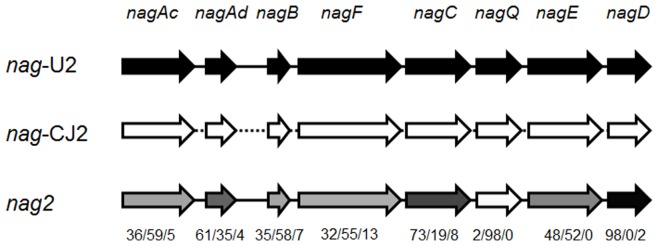
Figure 5. Structure of the nag operons revealed by BGT and pyrosequencing.
The nag2 operon was of a mosaic-type pattern. The gray scale of individual genes within the nag2 operon indicates % similarity to nag-U2 (black) or nag-CJ2 (white). The numbers beneath the nag2 operon indicates the % similarity to nag-U2/nag-CJ2/neither.

