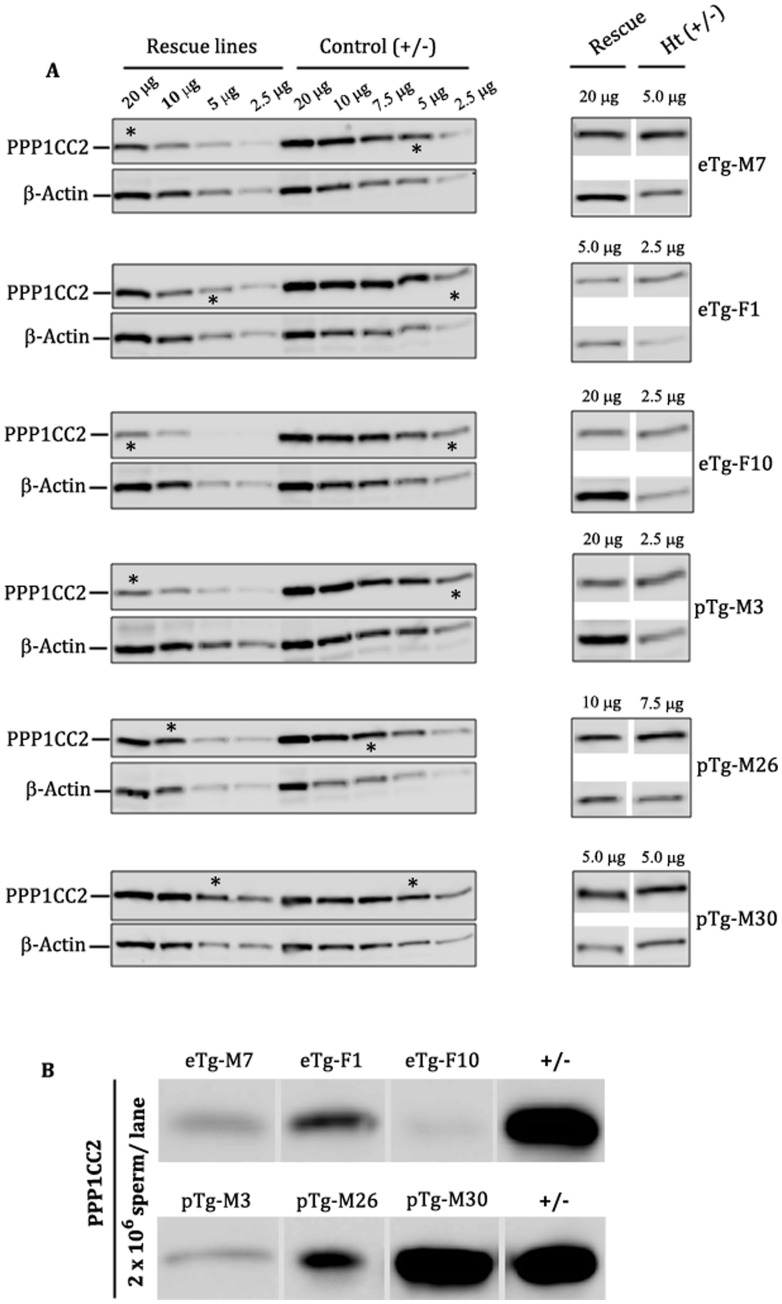
Figure 4. Comparison of steady state levels of transgenically expressed PPP1CC2 in testis and spermatozoa from all transgenic rescue lines.
(A) Western blot showing the levels of PPP1CC2 expressed in the testis of rescue lines compared with littermate controls. In the left panel protein estimated testis extracts from rescue animals were serially diluted to 20 µg, 10 µg, 5.0 µg and 2.5 µg and 20 µg, 10 µg, 7.5 µg, 5.0 µg and 2.5 µg from positive controls. (*) denotes the lane in which the band corresponding to rescue mouse PPP1CC2 expression is comparable in intensity to a band in a control mouse lane. In the right panels, (*) lanes are shown adjacent to each other for visual comparison. β-Actin was used as loading control. Each blot was repeated with preparations from different animals of the same line to confirm the original data. (B) Western blot of whole sperm protein extract demonstrate PPP1CC2 levels in spermatozoa. Protein extract from 2×10⁶ sperm was loaded in each lane for each rescue line and its littermate control. Upper panel represents PPP1CC2 levels in endogenous promoter driven rescue lines (eTg) while the lower panel represents PPP1CC2 levels in the hPgk2 promoter driven rescue lines (pTg). Note that the PPP1CC2 levels in spermatozoa roughly conform to their levels in the testis.

