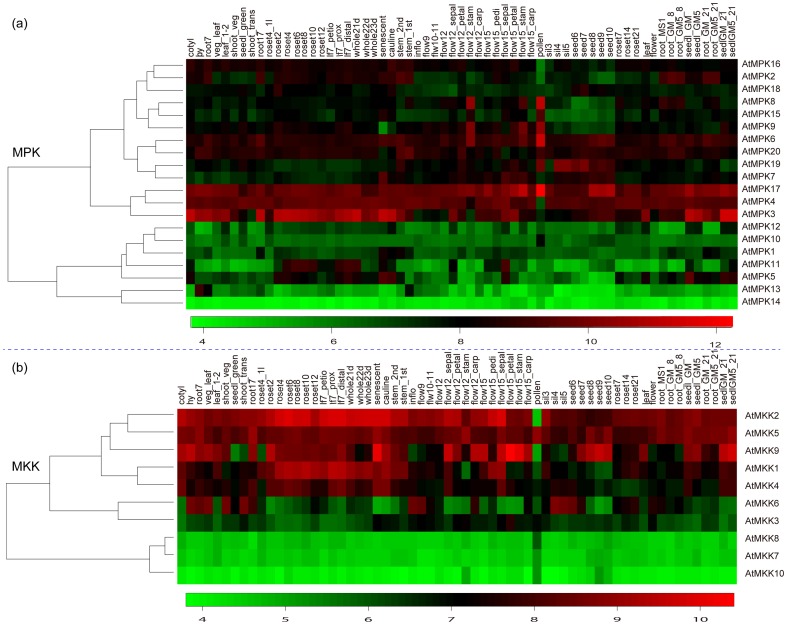
Figure 11. Expression profiles of 20 MAPK genes (a) and 10 MAPKK (b) genes in different Arabidopsis .
tissues. Details of the experimental conditions are provided in Table S3. Log2 based value was used to create the heatmap. Difference in gene expression changes is shown in color as the scale.

