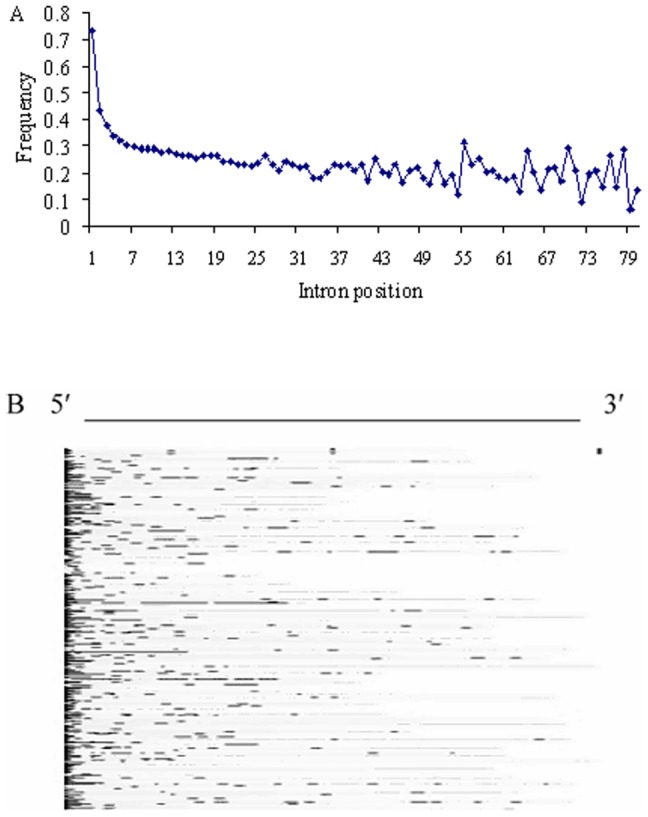
Figure 3. CpG island in the introns.

(A) Frequencies of introns containing CpG islands at different positions. (B) Locations of CpG islands in the first introns. 500 introns are selected randomly from the first introns. The CpG islands are represented as black lines in the first introns where other regions are represented as gray spaces. The sequence direction is from 5′-ends to 3′-ends of the first introns.
