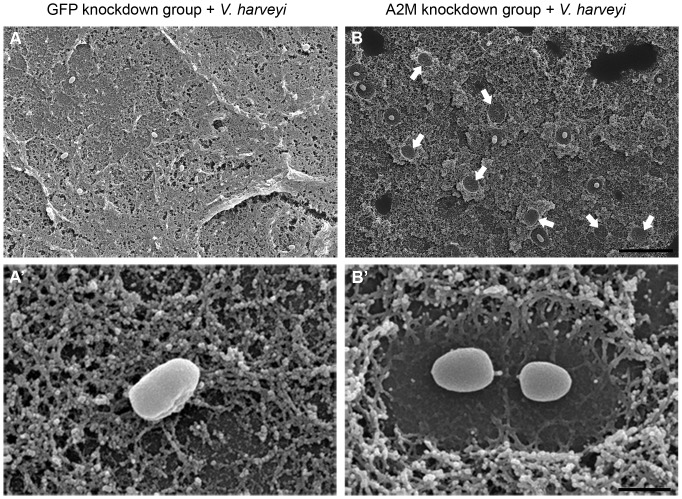
Figure 5. Observation of GFP-dsRNA and A2M-dsRNA treated clots in the presence of V. harveyi.
SEM was used at an accelerating voltage at 20 kV and a magnification of 2,000× (A, B) or 20,000× (A′, B′) were applied. Blood clots were formed by the hanging drop technique in the presence of V. harveyi from the hemolymph of (A, A′) GFP-dsRNA or (B, B′) A2M-dsRNA knockdown shrimp. Arrowheads demonstrate the fibrinolysis zones where the bacteria have escaped from the clot. Scale bars correspond to 10 µm in the upper sub-figures and 1 µm in the lower sub-figures. Images shown are representative of at least 3 such fields of view per sample.

