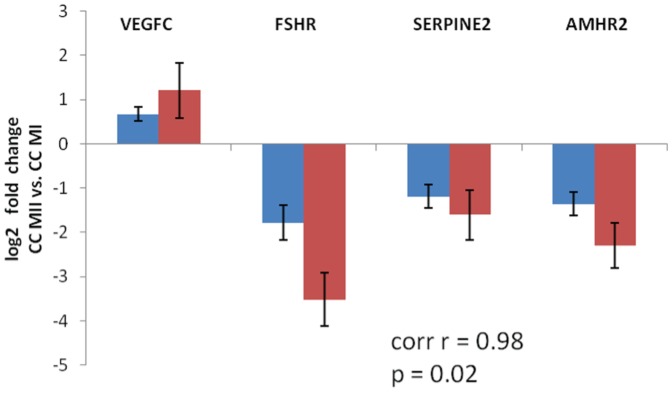
Figure 4. Expression (log2 fold change) of VEGFC, SERPINE2, AMHR2 and FSHR from microarrays and qPCR showing contrast between CC MII and CC MI.
Bars represent expression of CC MII vs. CC MI as log2 fold change with standard deviation. Blue represents microarray data and red qPCR data. Correlation coefficient (r = 0.98) and p value (p = 0.02) indicate strong and significant correlation between microarray and qPCR data. Corr r: Pearson correlation coefficient with p value between microarray and qPCR values. CC MI: cumulus cells of metaphase I oocytes. CC MII: cumulus cells of metaphase II oocytes.

