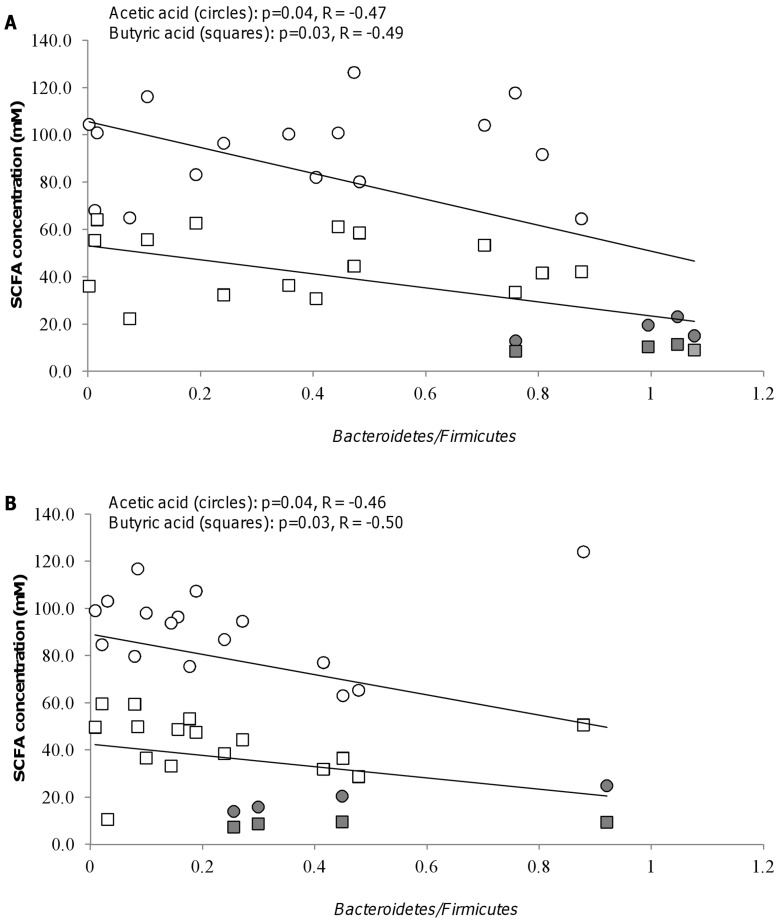
Figure 3. Correlation between Bacteroidetes/Firmicutes ratios and concentrations of SCFA.
Correlation between concentrations of acetic acid (○) and butyric acid (□) and Bacteroidetes/Firmicutes ratios (Bacteroides-Prevotella-Porphyromonas group/Clostridium perfringens cluster I, Clostridium coccoides - Eubacterium rectale group and Clostridial cluster XIV) for synbiotic combinations with Lactobacillus acidophilus NCFM (A) and Bifidobacterium animalis subsp. lactis Bl-04 (B). Concentrations of acetic and butyric acid in control fermentations are denoted by grey circles and squares, respectively. The Spearman Rank probabilities (p) and correlations (R) are shown in the graphs.

