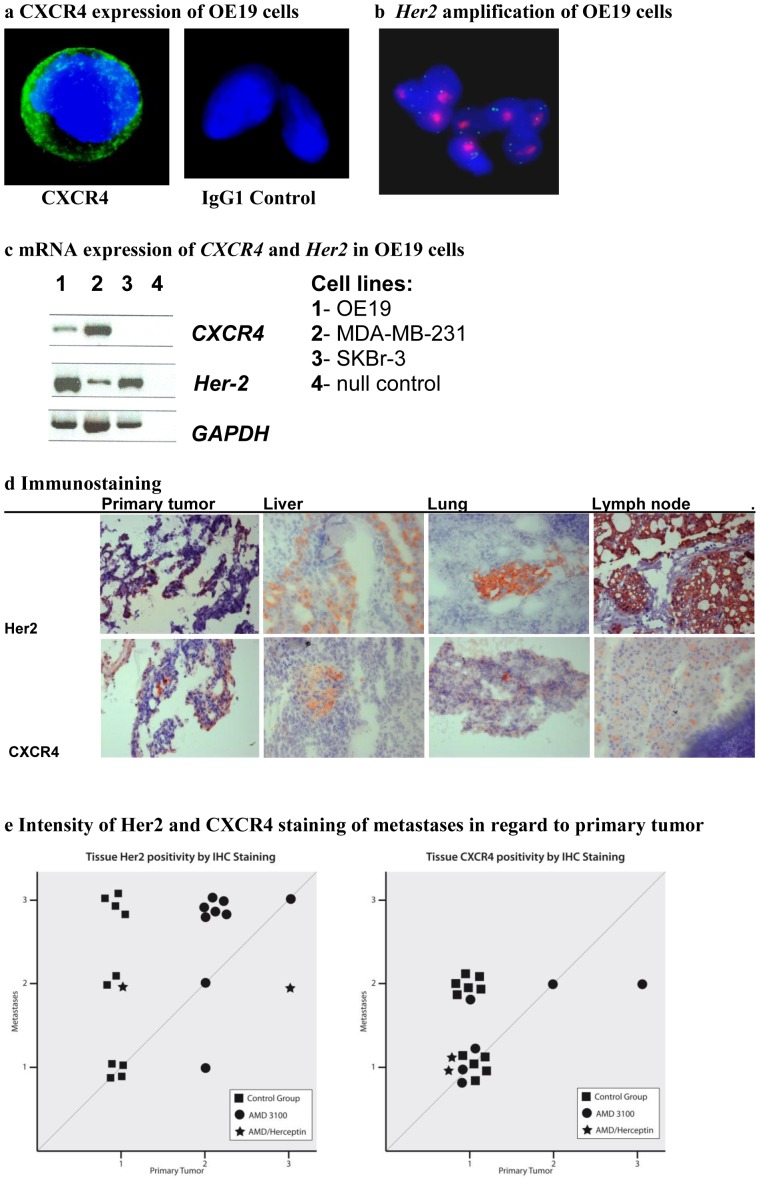
Figure 3.
A CXCR4-expression of OE19 cells determined by fluorescence immunostaining (IgG1-control) B Confirmation of Her2-amplification determined by fluorescence in situ hybridization (red: Her2-gene loci, green reference CENT-17-loci) C CXCR4 and HER-2 mRNA-expression analysis of esophageal cancer cell line OE19 compared to MDA-MB-231 and SKBr-3 cell lines and null control (nc). D CXCR4 and HER2 expression level analysis determined by immunostaining in primary tumor, liver, lung and lymph node. Representative images are shown from the tissues of an untreated animal (magnification ×100). E Intensity of HER2- and CXCR4-expression was scored in primary tumor and metastases. Positivity-scores of primary tumor and respective metastases were matched to evaluate the occurrence of and correlation of primary tumor expression and that of its respective metastases between the therapeutic groups. Trastuzumab treatment led to an absence of metastases and thus could not be included. * Due to space limitations, AMD3100 was abbreviated to AMD in Figure 3e .

