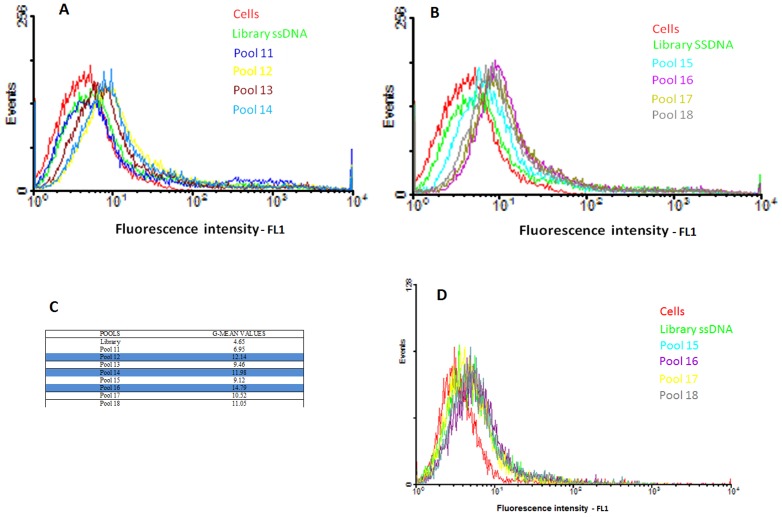
Figure 1. Progress of cell-SELEX methodology.
Binding assay of pools 11–18 with H23 (A–B) and pools 15–18 with HBE135 E6/E7 (C). Flow cytometry assay to monitor the binding of selected pool with H23 cells (target cells) and HBE135 E6/E7 (negative cells). The green curve represents the background binding of unselected DNA library. For H23 cells, there was an increase in binding capacity of the pools as the selection progressed, whereas there was little change for the control cells, HBE 135 E6/E7. Aim figure 1: The aim of this figure is to show how the cell-selection process was enriched for H23 cell line but not for HBE135E6/E7 cell line.

