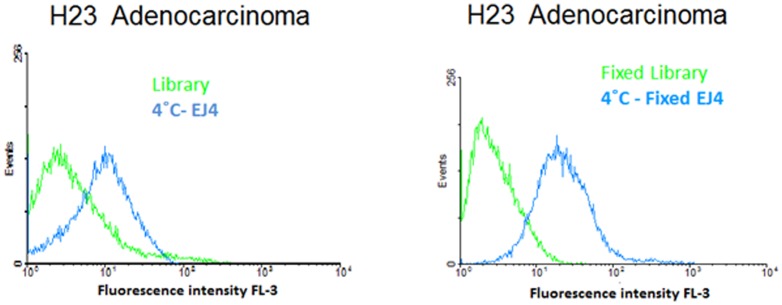
Figure 4. Binding assays after fixation with 10% formalin.
Binding assay of aptamers with H23 (target) cells pre-fixed with 10% formalin. Left column shows the binding of selected aptamers with untreated cells at 4°C. Right column shows the binding of selected aptamers fixed cells. The light green curve represents the background binding of a random sequence (library). Aim figure 4: The aim of this figure is to show the binding capability of the selected aptamer EJ4 to cells that have been fixed with 10% formalin.

