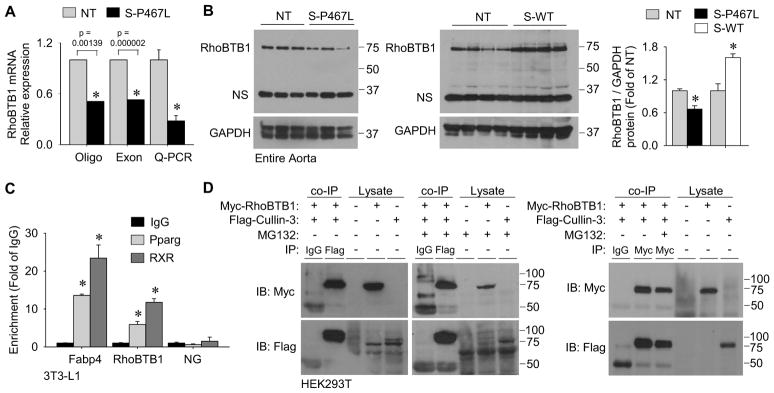
Figure 3. Identification of the Cullin-3 interacting protein RhoBTB1 as a PPARγ target gene.
(A) Relative mRNA expression of RhoBTB1 in aortic tissue from S-P467L mice relative to NT littermates in two independent microarray experiments using different array platforms and validation by Q-PCR (n=10–11). Oligo array refers to the Affymetrix mouse genome 2.0 array (probe set 1429656_at, n=2 for NT and n=3 for S-P467L) and Exon array refers to the Affymetrix mouse exon 1.0 ST array (probe set 6768601, n=5 for NT and n=7 for S-P467L). (B) Western blot for RhoBTB1protein expression in aorta from S-P467L and littermate NT mice (n=8) or from S-WT and littermate NT mice (n=4) and quantification. “NS” indicates non-specific band. (C) Validation of PPARγ and RXR binding at FABP4 and RhoBTB1 PPREs by ChIP from duplicate experiments. Data is displayed as the fold enrichment relative to the IgG signal at the region of interest (* p<0.05 Pparg or RXR vs. IgG). NG represents a non-specific region of the genome which does not contain any known PPRE sequences. (D) Immunoprecipitation (IP) experiments using HEK293T cells transfected with plasmids expressing Myc-RhoBTB1, Flag-Cullin-3 or both. The antisera used for each IP is indicated. Lysates indicate samples not subjected to IP as controls for antisera specificity. Cells were treated with either MG132 (5 μmol/L) or vehicle (DMSO). The left blots are representative of n=4, and the right blot was representative of duplicate experiments. See also Figure S4. * p<0.05 S-P467L or S-WT vs. NT. Error bars represent SEM.

