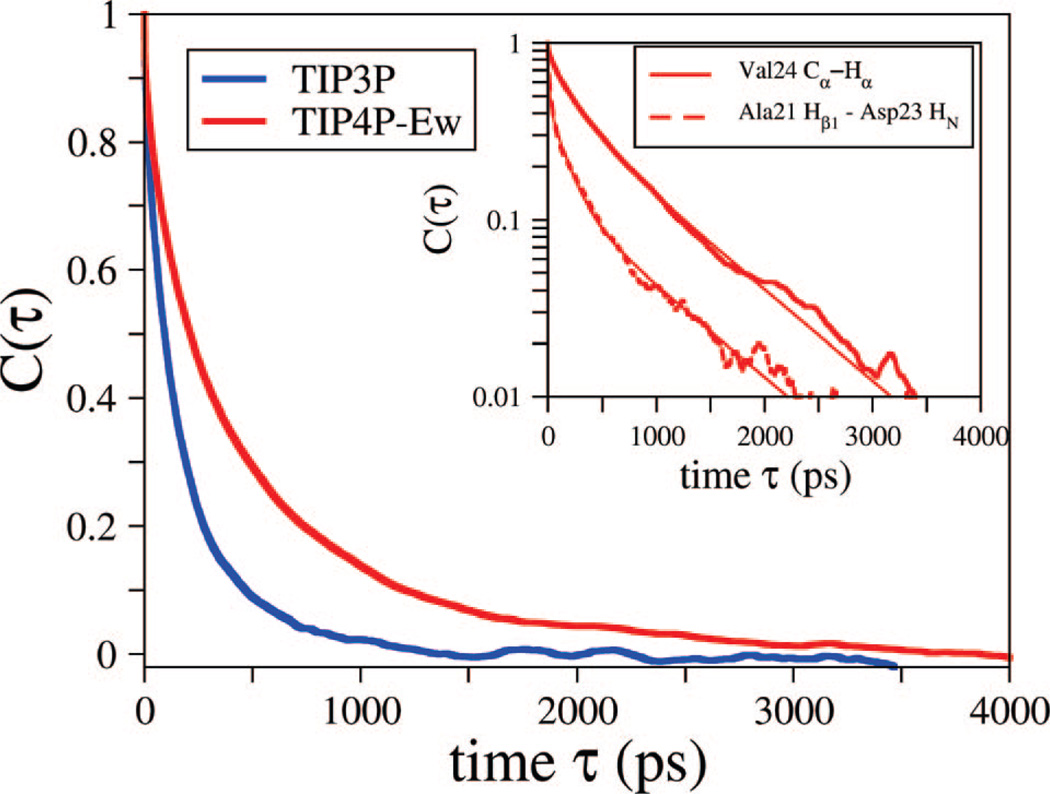
Figure 3.
Normalized average vector time correlation function for Val24 Cα to Hα position for constant energy trajectories solvated with TIP4P-Ew and TIP3P. The TIP3P model (blue) shows a dramatically faster decay for all vector time correlation functions relative to TIP4P-Ew (red), and we present this as an example. The inset presents example time correlation functions along with the triple exponential fits used in this study on a logarithmic y-axis to evaluate convergence. Presented are Val24 Cα to Hα, and Ala21 Hβ1 to Asp23 HN as an example of a pair used for the relaxation experiment predictions and the ROESY peak predictions, respectively.

