
Table 3.
Results for secondary outcome measures
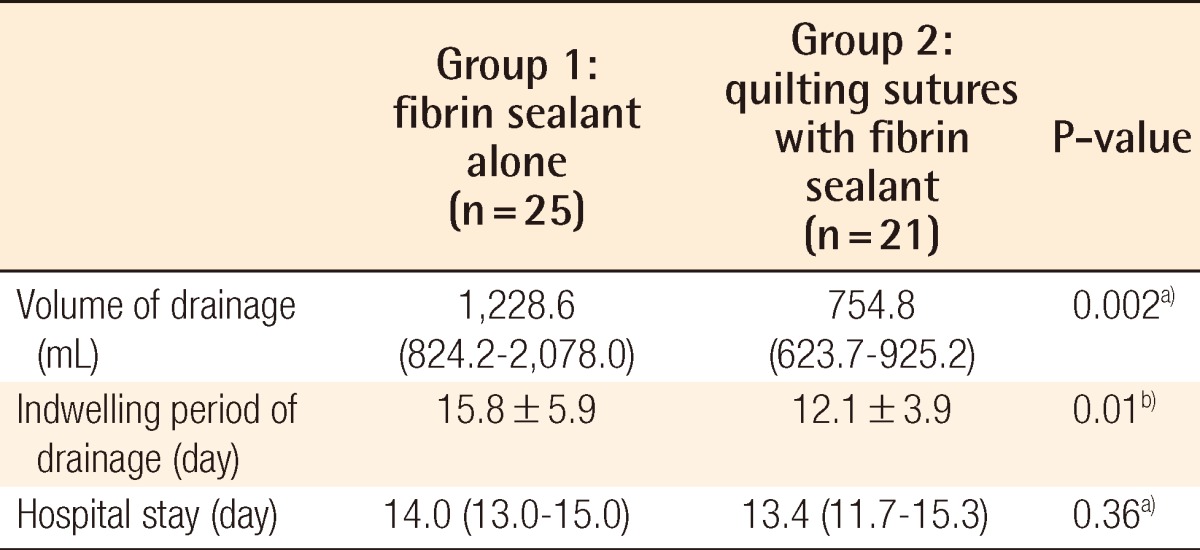
Values are presented as mean±standard deviation or median (interquartile range).
a)Mann-Whitney U test; b)Independent t test.
Official websites use .gov
A
.gov website belongs to an official
government organization in the United States.
Secure .gov websites use HTTPS
A lock (
) or https:// means you've safely
connected to the .gov website. Share sensitive
information only on official, secure websites.
Results for secondary outcome measures
Values are presented as mean±standard deviation or median (interquartile range).
a)Mann-Whitney U test; b)Independent t test.