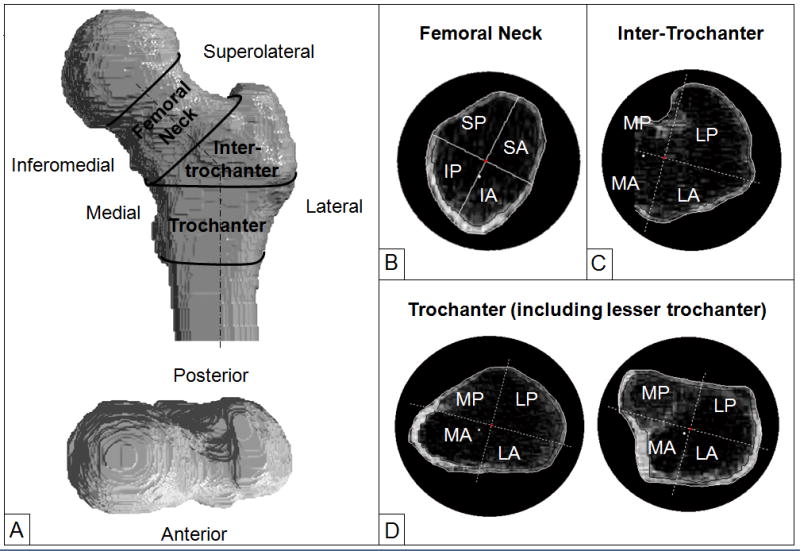
Figure 1.
(A) Regions of interest for analysis of volumetric BMD and cortical thickness in the proximal femur. (B) Quadrants of cross sections in the femoral neck. IA: infero-anterior; IP: infero-posterior; SA: superoanterior; SP: supero-posterior. (C) Quadrants of cross sections in the intertrochanter. Notice that the cross sections are not complete medially since it is bounded by the femoral neck; (D) Quadrants of cross section in the trochanter: left image shows a cross section in the proximal trochanter and right image a cross section at the lesser trochanter. The black lines inside the bone cross sections separate cortical and trabebular bone. MA: medio-anterior; LA: latero-anterior; MP: medio-posterior; SP: supero-posterior.

