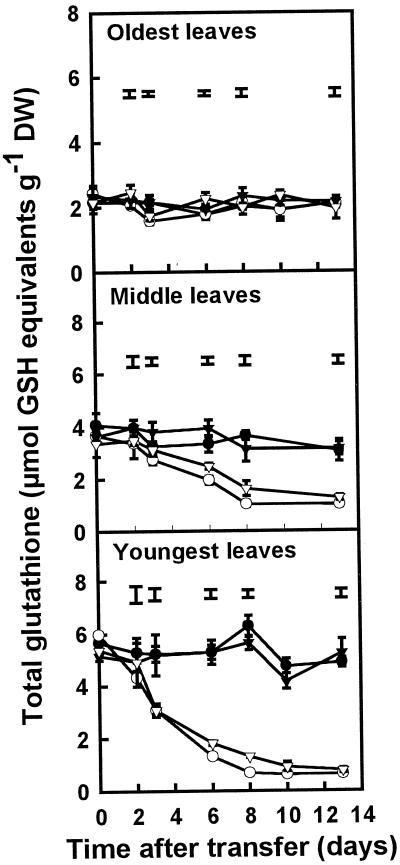
Figure 5.
Total glutathione concentrations (GSH plus GSSG) in the oldest, middle, and youngest leaves of plants grown in the presence or absence of SO42− at either high (7 mm) or low (0.25 mm) NO3−. Plants were grown for 3 weeks on 1 mm SO42− and 7 mm NO3− before transfer to the four different treatments at d 0. Data are the means ± se of three separate plant samples. The lsd (P < 0.05) for each time point is shown by vertical bars. There was no significant difference between treatments in the oldest leaves. Open symbols, minus S; closed symbols, plus S; circles, high N; triangles, low N. DW, Dry weight.

