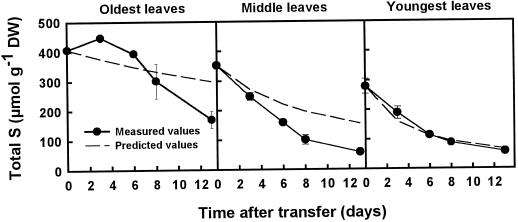
Figure 8.
Concentrations of total S in the oldest, middle, and youngest leaves of plants grown in the absence of S and at high (7 mm) NO3− compared with the predicted values for each leaf type. Predictions were based on the growth rate, assuming that no S was transported into or out of each plant part, and therefore predicted values represent a dilution curve attributable to growth. Closed circles, Measured values; dashed lines, predicted values. DW, Dry weight.

