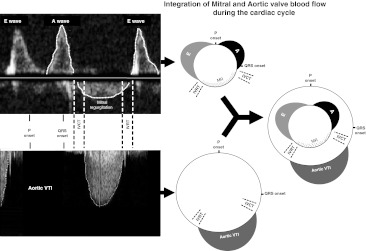
Fig. 1.
A schematic illustration combining the transmitral and aortic flow during the cardiac cycle. To simplify understanding of Doppler flows (left), they can be sketched wrapped into a circle, representing the cardiac cycle, starting with atrial activation (“P onset”). The mitral (top) and aortic (bottom) flow traces are inscribed upon inner and outer circles, which can be combined into a single diagram (right). This allows clear demonstration of the interaction between timings of activation, forward flow, mitral regurgitation and isovolumic contraction and relaxation times (IVCT and IVRT)

