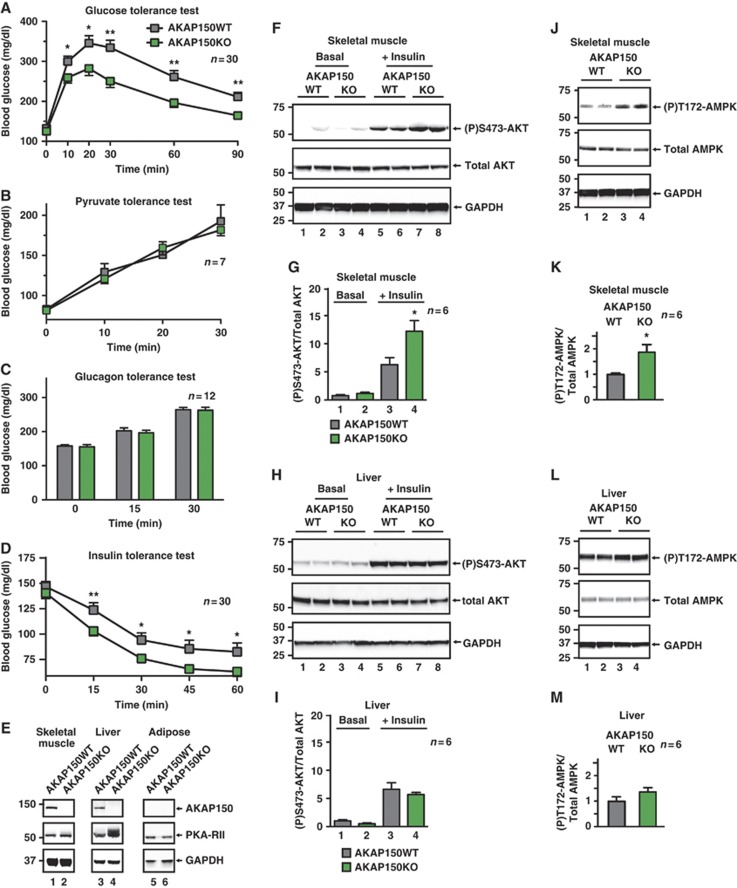
Figure 3.
Glucose tolerance and peripheral insulin sensitivity in AKAP150KO mice. (A) Blood glucose profiles of WT and AKAP150KO mice during IP glucose (1.5 g/kg) tolerance test (IPGTT). Integrated glycemic responses are found in Supplementary Figure S3A. (B) Blood glucose profiles of WT (grey) and AKAP150KO (green) mice following IP injection of pyruvate (1.5 g/kg) into fasted animals as an index of gluconeogenesis. (C) Changes in blood glucose in response to IP injection of glucagon (25 nmol/kg) in fed WT (grey) and AKAP150KO (green) mice as an index of glycogenolysis. (D) Glycemic profiles of WT (grey) and AKAP150KO (green) mice following IP injection of recombinant insulin (0.5 U/kg). (E) Immunoblot detection of AKAP150, PKA-RII and GAPDH in gastrocnemius muscle, liver and epididymal fat pad homogenates from WT and AKAP150KO mice. (F) Immunoblot detection of active (P)Ser473-Akt, total Akt and GAPDH from gastrocnemius muscle homogenates from WT and AKAP150KO mice 15 min after IP saline or insulin (1.0 U/kg) injection. Two biological replicates are shown for each genotype and condition. Quantification of compiled results was performed by densitometry analysis of active (P)Ser473-Akt normalized to total respective protein level (G). (H) Immunoblot detection and (I) densitometry analysis of active (P)Ser473-Akt, total Akt and GAPDH from liver homogenates from WT and AKAP150KO mice as per (F, G). (J) Immunoblot analysis of active (P)Thr172-AMPK, total AMPK and GAPDH from skeletal muscle homogenates from WT and AKAP150KO mice. Two biological replicates are shown for each genotype and condition. Quantification of compiled results was performed by densitometry analysis of active (P)Thr172-AMPK normalized to total respective protein level (K). (L) Immunoblot detection and (M) densitometry analysis of (P)Thr172-AMPK, total AMPK and GAPDH from liver homogenates from WT and AKAP150KO mice as per (J, K). Data represent mean±s.e.m. *P⩽0.05, **P⩽0.01. Immunoblots are representative of three independent experiments; densitometry represents results from six individual animals of each genotype. Figure source data can be found with the Supplementary data.

