
Figure 2.
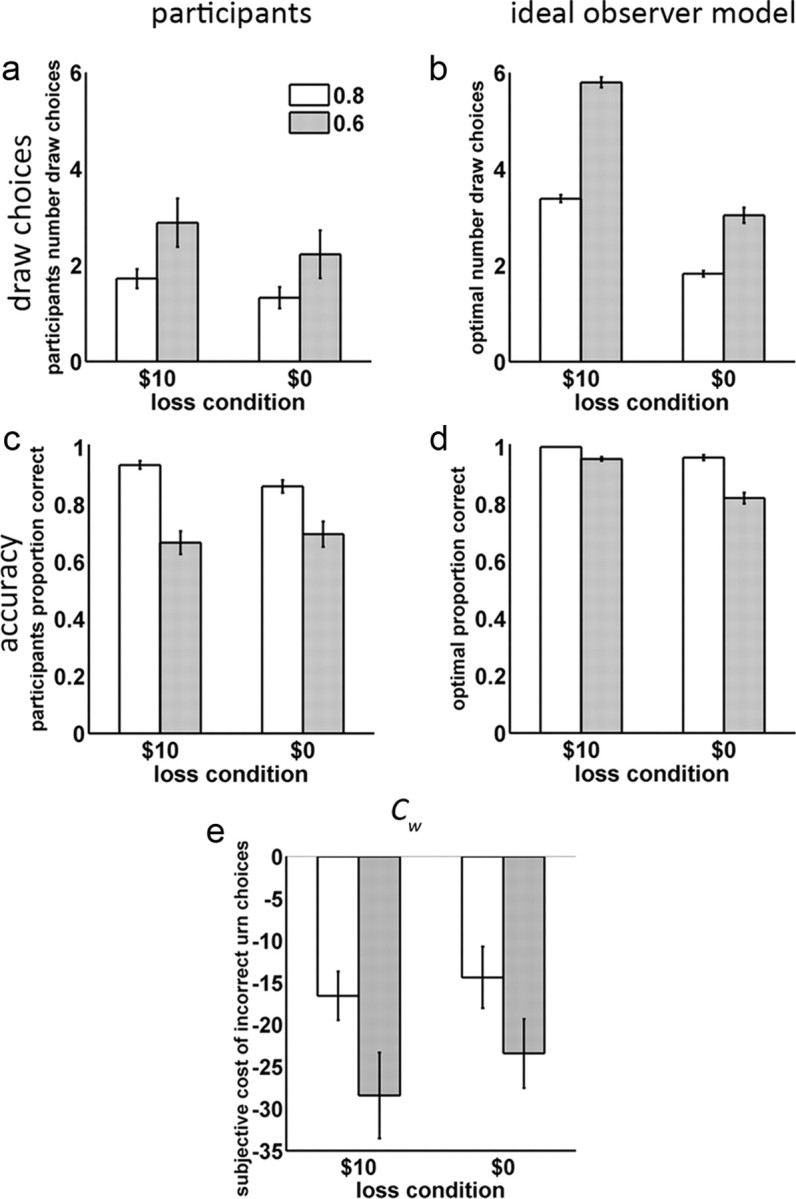
Behavioral performance as a function of color probability and loss. a, Mean and SE of the number of draws chosen by participants. b, Optimal number of draws derived from ideal observer. Although the same ideal observer model was always used to compute optimal performance for all sequences, we organized our results so that ideal observer performance scores could be separately matched to each participant's performance. These participant-matched scores were used to compute SEs (error bars) and statistical contrasts with participants. c, Mean and SE of the participants' accuracy. d, Optimal accuracy for ideal observer (SEs computed over participant-matched scores. e, The cost of incorrect urn choices Cw, estimated from participant behavior using parameterized Bayesian model.