
Figure 5.
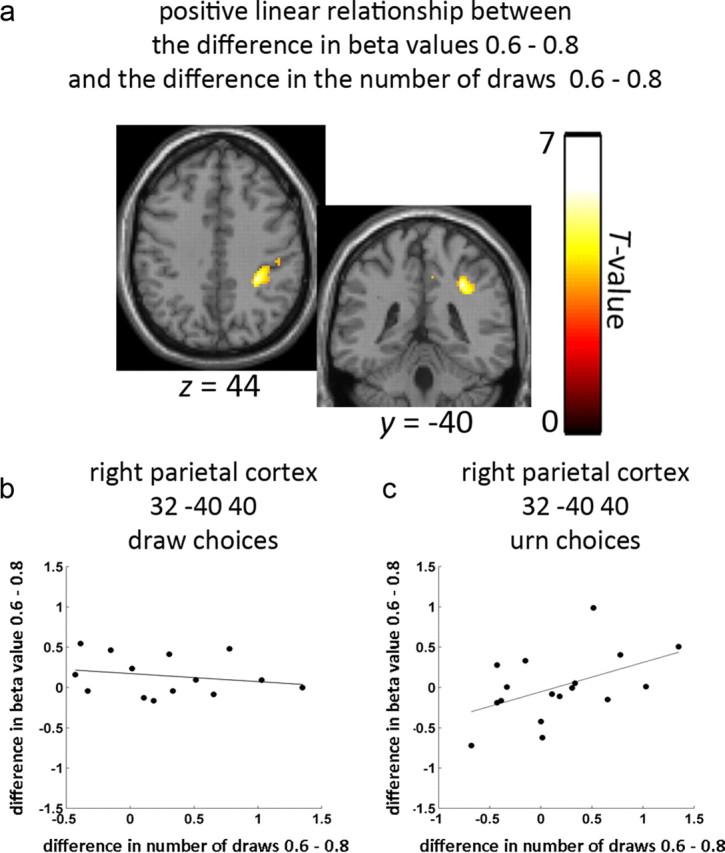
Parietal cortex was associated with the majority color probability behavioral effect. a, Area in right parietal cortex where individual differences in the beta value contrast 0.6 > 0.8 (effect of color probability) predicted corresponding differences in the number of draw choices (0.6 > 0.8), thresholded at p < 0.001. b, Scatter plot showing no relationship between the color probability fMRI contrast (beta values at the peak voxel in right parietal cortex) for draw choices and the size of the probability effect on the number of draws. c, Scatter plot showing a positive linear relationship between the probability fMRI contrast (beta values at the peak voxel in right parietal cortex) for urn choices and the size of the color probability effect on the number of draws.