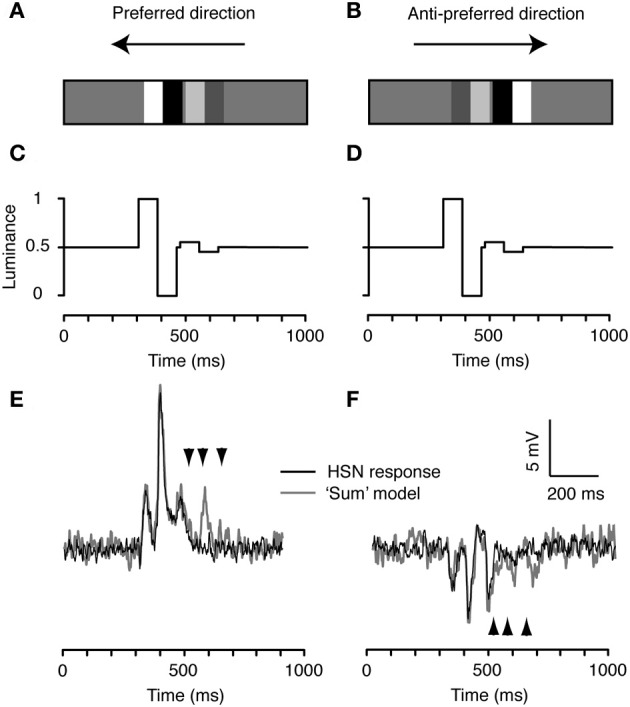
Figure 4.

The decreasing contrast pair. (A) We combined the high and low contrast doublets to produce an ensemble with the high-contrast doublet preceding the low contrast doublet. (B) The spatial arrangement is flipped for stimulation in the anti-preferred direction so that the temporal order of contrast changes remains the same. (C) Time-luminance trace for motion in the preferred direction. (D) Time-luminance trace for motion in the anti-preferred direction. (E) HS response to the decreasing contrast pair moving in the preferred direction. The gray line indicates the predicted response based on the linear sum of the response to each individual doublet (see Figure 2). The arrowheads highlight the timing of the three peaks to the second doublet, predicted from the model output (see Figure 2). (F) Intracellular response of an HS neuron to the pair moving in the anti-preferred direction. The gray line indicates the linear sum of the response to the individual doublets (see Figure 2). The arrowheads highlight the timing of the three peaks to the second doublet, predicted from the model output. n = 20 from the same neuron as shown in Figures 2 and 3.
